MagnifyMoney 


The story of the United States is the story of people migrating to different cities and towns to build new lives through new opportunities. From the promise of gold to the promise of big tech in Northern California; from trading furs to building cars in Detroit; from the prosperity of shipping to the prosperity of hospitality in Charleston, the country is built on boomtowns.
We wanted to find out where Americans are gathering now to take advantage of growing prosperity and improved lifestyles to achieve the American dream.
To find out which of America’s metros are booming, we looked at how much each metro has changed between 2011 and 2016 (the most recent year for which all data is available at the metro level) in three different categories, which we scored independently before combining the results to reach a metro’s final score.
The first thing we looked at was how much business and industry has grown locally. We not only wanted to know how many new businesses there are but also how businesses in general are doing, as measured by their increase in hiring and — for businesses that don’t have employees, known as non-employers — how much revenue has increased.
The most essential component to a boomtown is this: Are people coming, and is the metro growing to keep up? To figure that out, we used the Census Bureau’s American Community Survey (ACS) to measure changes in total population and the number of housing units.
People generally enter a local workforce because they seek better opportunities, so we wanted to see how that changed, along with improvements to the unemployment rate and the increase in earnings.
Some of the metros that have been declared among the “fastest growing” in the news may fall lower on our list on than one would expect. For example, Greenville, S.C., has been touted as one of the fastest growing cities in America, but we see a population growth of 5.5% over the five-year period. Nothing to sniff at, but it’s the 13th highest on our list rather than in the top five.
One reason is that we looked at the five-year growth period rather than one year. Another is that the Census changed the area of some metros, so additional counties were added between 2012 and 2013. To make sure we were actually talking about the exact same footprint, we used and compared the data for counties that are currently in each metropolitan statistical area.
These are the metros that are seeing the biggest influx of people, work opportunities and business growth.

Final Score: 87.8
Austin jumps way out ahead of all the metros we reviewed, showing the greatest five-year growth in population and housing, earning a perfect Population & Housing score of 100. Even so, the increase in housing units of 10% isn’t keeping up with the population growth of almost 16% over a five-year period. Interestingly, almost all of those gains in population have gone directly to the local workforce, and that, combined with a 23% drop in unemployment and an almost 9% increase in median wages, gives Austin the highest Workforce & Earnings score (70.3) on our list. While the metro comes in second for Business Growth, it’s with an A score of 93, thanks to a 21% increase in the number of businesses and a 24% increase in the number of employees those firms hired.
Final Score: 75.7
Business is booming in Provo, with 20% more businesses in 2016 than in 2011 employing 30% more workers. This gives the metro the top Business Growth score of 95.1. It also ranks high in Population & Housing, coming in third with a score of 79.9 thanks to a population increase of 12% and a housing increase of 8%. The Workforce & Earnings score is a respectable 52.2 (8th highest on our list), thanks to 13% growth in the workforce, and an OK drop in unemployment compared with other metros, at 20% (32nd). But wages don’t seem to be keeping up, as the median earnings for workers is only 3.5% higher than it was five years earlier (63rd).
Final Score: 67.7
The second biggest population and housing increases — 13% and 9%, respectively — give Raleigh the second highest Population & Housing score of 84.1. North Carolina’s capital ranks No. 5 in Business Growth with a score of 70.8, boasting a 13% increase in establishments and a 21% increase in paid employees. Raleigh earned the 10th highest Workforce & Earnings score (48.3), thanks to 12% increase in the civilian labor force, which offset the mediocre (relative to the other metros on our list) 18% drop in the unemployment rate and a median earnings growth of under 4%.
Final Score: 66.4
Nipping at Raleigh’s heels, the historical coastal city saw its population jump by 11% between 2011 and 2016. The increase in housing units hasn’t kept up, at just over 6%, giving Charleston the fifth-highest Population & Housing score (66.9). The Business Growth score is the fourth highest on our list, at 71.7, due to a 14% increase in business establishments and 17% increase in paid employees (the fifth and 18th highest gains on our list, respectively). Charleston shines even more in Workforce & Earnings category, with a score of 60.6, the third highest on our list. The healthy 22% drop in unemployment and an 11% increase in the workforce (closely matching the overall population increase) are matched by the seventh-highest median wage increase of over 9%.
Final Score: 60.7
Business is good in Nashville, where firms grew their staff by 21% (fourth highest), numbers that seem to be in excess of the 10% increase in establishment (22nd highest). That earned Nashville a Business Growth score of 72.9, the third highest among the metros we reviewed. It follows that the metro, which has long been diversifying from its country music legacy, has the fifth highest Workforce & Earnings score of 54.6, thanks to a 9% increase in workforce (ninth highest), a 25% drop in unemployment (14th highest), and 7% increase in median earnings for workers (16th highest). An interesting note is that the increase in the workforce is actually greater than the overall increase in population of just under 9% (14th highest), suggesting that the boom may be luring people to work. Although at 5%, housing growth isn’t keeping up with the influx of people, it is the 13th biggest increase on our list and adds up to a Population & Housing score of 54.5.
Not every metro is growing, and some are even contracting. These are the five most sluggish of the metros we reviewed.
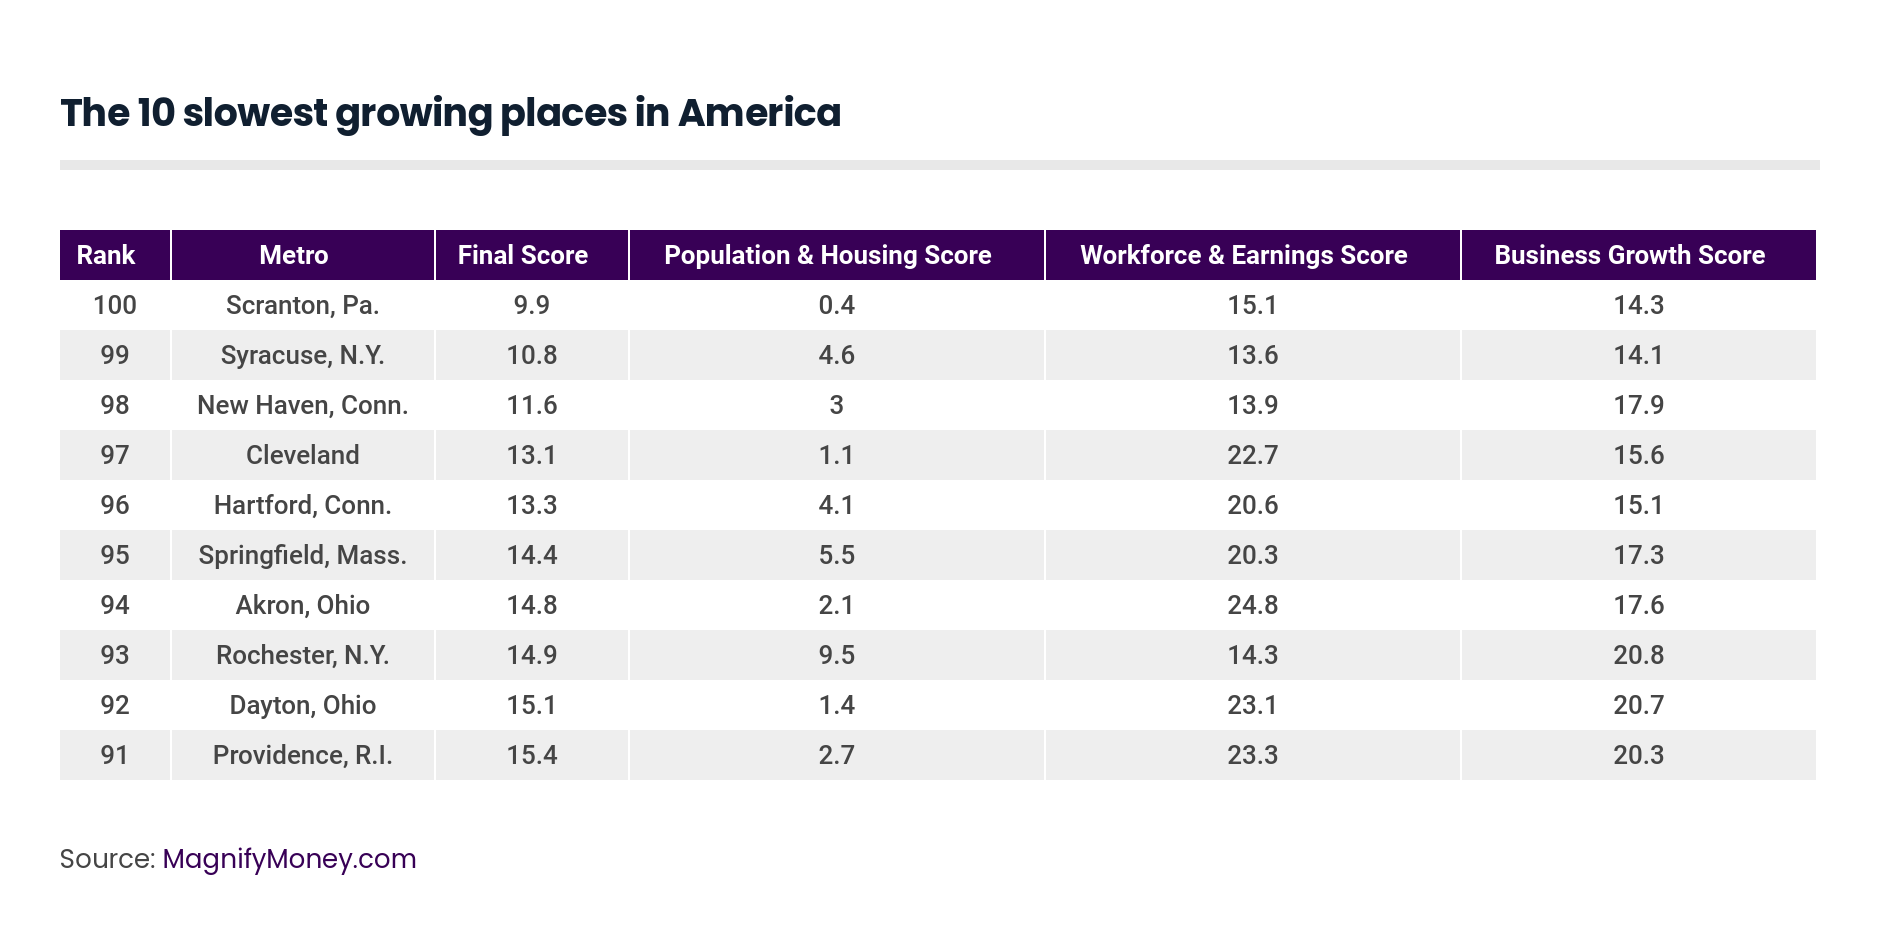
Final Score: 9.9
Believe it or not, Scranton’s 0.4 Population & Housing score wasn’t the lowest on our list (Toledo, Ohio earned a perfect 0.0), but it is the result of a population drop of 0.4% and a 0.1% increase in housing units. At 14.3, Scranton had the third lowest Business Growth score (Pittsburgh and Syracuse, N.Y. fare worse at 13.2 and 14.1 respectively), thanks to an incremental 0.6% increase in business establishments. However, businesses did slightly better in hiring 5.5% more employees, the 15th lowest on our list. One bright spot is the rise in median earnings for workers — at 8.4%, it was the 11th highest of all the metros we reviewed. Unfortunately, it wasn’t enough to counter the 1.4% drop in labor force that presumably followed the drop in population, or the slight increase in unemployment (the fifth and sixth smallest gains on our list). That adds up to a Workforce & Earnings score 15.1, the 12th lowest on our list.
Final Score: 10.8
Business isn’t great in this upstate college town; only one other metro (Pittsburgh) got a score lower than Syracuse’s Business Growth score of 14.1. The metro saw no change in the number of business establishments, and businesses only increased their staff by 4% (the eighth lowest on our list). The population stayed steady with a 0.1% increase and was slightly outpaced by new housing units (0.9%), earning the metro a Population & Housing score of 4.6, the 12th lowest on our list. A 0.4% decrease in workforce and a marginal decrease in the unemployment rate of 3.2% offset the metro’s respectable 5.9% gain in median earnings (33rd highest), leaving Syracuse with the eighth-lowest Workforce & Earnings score (13.6).
Final Score: 11.6
People aren’t moving to this Ivy League community, and the people there seem to be leaving the workforce. Unemployment was down almost 9%, which seems great, but 72 other metros on our list saw bigger improvements, and 66 other metros had their median earnings increase by more than the 3% New Haven did. Business establishments grew by almost 2% in New Haven in five years (80th out of 100), but they only took on 5% more workers (90th place). That general stasis earned New Haven a score of 3 for Population & Housing (10th lowest), 13.9 for Workforce & Earnings (ninth lowest) and 17.9 in Business Growth (ninth lowest).
Final Score: 13.1
People seem to be leaving metros in Ohio, and Cleveland is no exception, experiencing a population decrease of just under 1%. In fact, it was the biggest population loss of all metros we reviewed. There was a small increase of 0.2% in housing units (fourth lowest), which is why Cleveland’s Population & Housing score of 1.1 came in ahead of Toledo, Ohio and Scranton, Pa. The number of establishments actually went down by about 1% (second only to Toledo’s loss of 1.4%), and the remaining businesses only increased their staff by about 4% (the fifth lowest gain). Overall, Cleveland’s Business Growth score of 15.6 was the sixth lowest on our list. On a brighter note, Cleveland earned a Workforce & Earning score of 22.7 (71st out of 100), thanks to a substantial 17% reduction in unemployment (46th out of 100) and over 4% more in median earnings (52nd), but these results were dragged down by a workforce that shrank by 1.4%, the fourth biggest loss on our list.
Final Score: 13.3
The good news is that median earnings for workers in Hartford went up by 6.6%, the 23rd highest on our list. The drop in unemployment was almost 9%, which seems like a lot, but 74 metros on our list did better. That, combined with a barely perceptible 0.3% increase in the workforce gave Hartford a Workforce & Earnings score of 20.6, which ranks 76th out of 100. Unfortunately, it’s downhill from there, with 90th place in the Population & Housing score because of a population growth of 0.3% and a housing unit increase of 0.6%. Connecticut’s capital had the 5th lowest Business Growth score of 15.1, thanks mostly to a lackluster 7% increase in receipts by non-employer businesses (second lowest on our list).
Limiting our research to the current 100 largest metropolitan statistical areas (“MSAs”), we tracked the five-year change between 2011 and 2016 (the last year for which all data was available) using data from the U.S. Census American Community Survey and County Business Patterns in the following categories:
Population & Housing:
Workforce & Earnings:
Business Growth:
Because the U.S. Census has changed the boundaries of some MSAs in the intervening years, we collected the data at the county level and then mapped it to the current MSA borders.
Each data series was scored relative to the other metros so that the biggest positive change received a score of 100 and any zero or negative changes received a score of 0 (except for unemployment rate, where this was reversed). For each category, these scores were summed and then divided by the number of series in each category, for a highest possible category score of 100 and a lowest of 0. The three category scores were then summed and divided by three for a final score. The highest possible final score was 100 and the lowest was 0.
 Kali McFadden
Kali McFadden is a senior research analyst at LendingTree and MagnifyMoney based in Charlotte, N.C., where she conducts data-driven studies of issues related to personal finance and economics.
Read More