MagnifyMoney 


The numbers don’t lie: As college costs have risen in recent decades, many students and their families have been forced to take out more student loans to keep up. Seeing the statistics behind college debt can help shine a light on how big the student loan crisis has become and whom it’s affecting most.
To get a complete picture of the situation, we’ve collected recent data on student loans, college costs and other student aid.
In recent decades, college costs have shot up, often forcing today’s students and their families to pay more out of pocket and borrow more in student loans to cover educational expenses.
Here’s a look at the average college costs that today’s students face, by different types of institutions.
| Average College Costs All Institutions | ||||||||
|---|---|---|---|---|---|---|---|---|
| For-Profit Institutions | $14,419 | $6,889 | $4,123 | $25,431 | ||||
| Source: The National Center for Education Statistics | ||||||||
Average College Costs 4-Year Institutions | ||||||||
| Tuition and Fees | Dormitory Rooms | Board | Total | |||||
| All Institutions | $15,512 | $6,231 | $4,850 | $26,593 | ||||
| Public Institutions | $8,804 | $6,017 | $4,666 | $19,488 | ||||
| Nonprofit Institutions | $32,720 | $6,709 | $5,273 | $44,702 | ||||
| For-Profit Institutions | $14,423 | $6,996 | $4,113 | $25,532 | ||||
| Source: The National Center for Education Statistics | ||||||||
Average College Costs 2-Year Institutions | ||||||||
| Tuition and Fees | Dormitory Rooms | Board | Total | |||||
| All Institutions | $3,518 | $3,931 | $3,149 | $10,598 | ||||
| Public Institutions | $3,156 | $3,822 | $3,113 | $10,091 | ||||
| Nonprofit Institutions | $15,293 | $5,609 | $4,350 | $25,252 | ||||
| For-Profit Institutions | $14,397 | $6,290 | $4,340 | $25,027 | ||||
| Source: The National Center for Education Statistics | ||||||||
| Tuition and Fees | Dormitory Rooms | Board | Total | |||||
| All Institutions | $12,219 | $6,106 | $4,765 | $23,091 | ||||
| Public Institutions | $6,817 | $5,859 | $4,561 | $17,237 | ||||
| Nonprofit Institutions | $32,556 | $6,704 | $5,291 | $44,551 | ||||
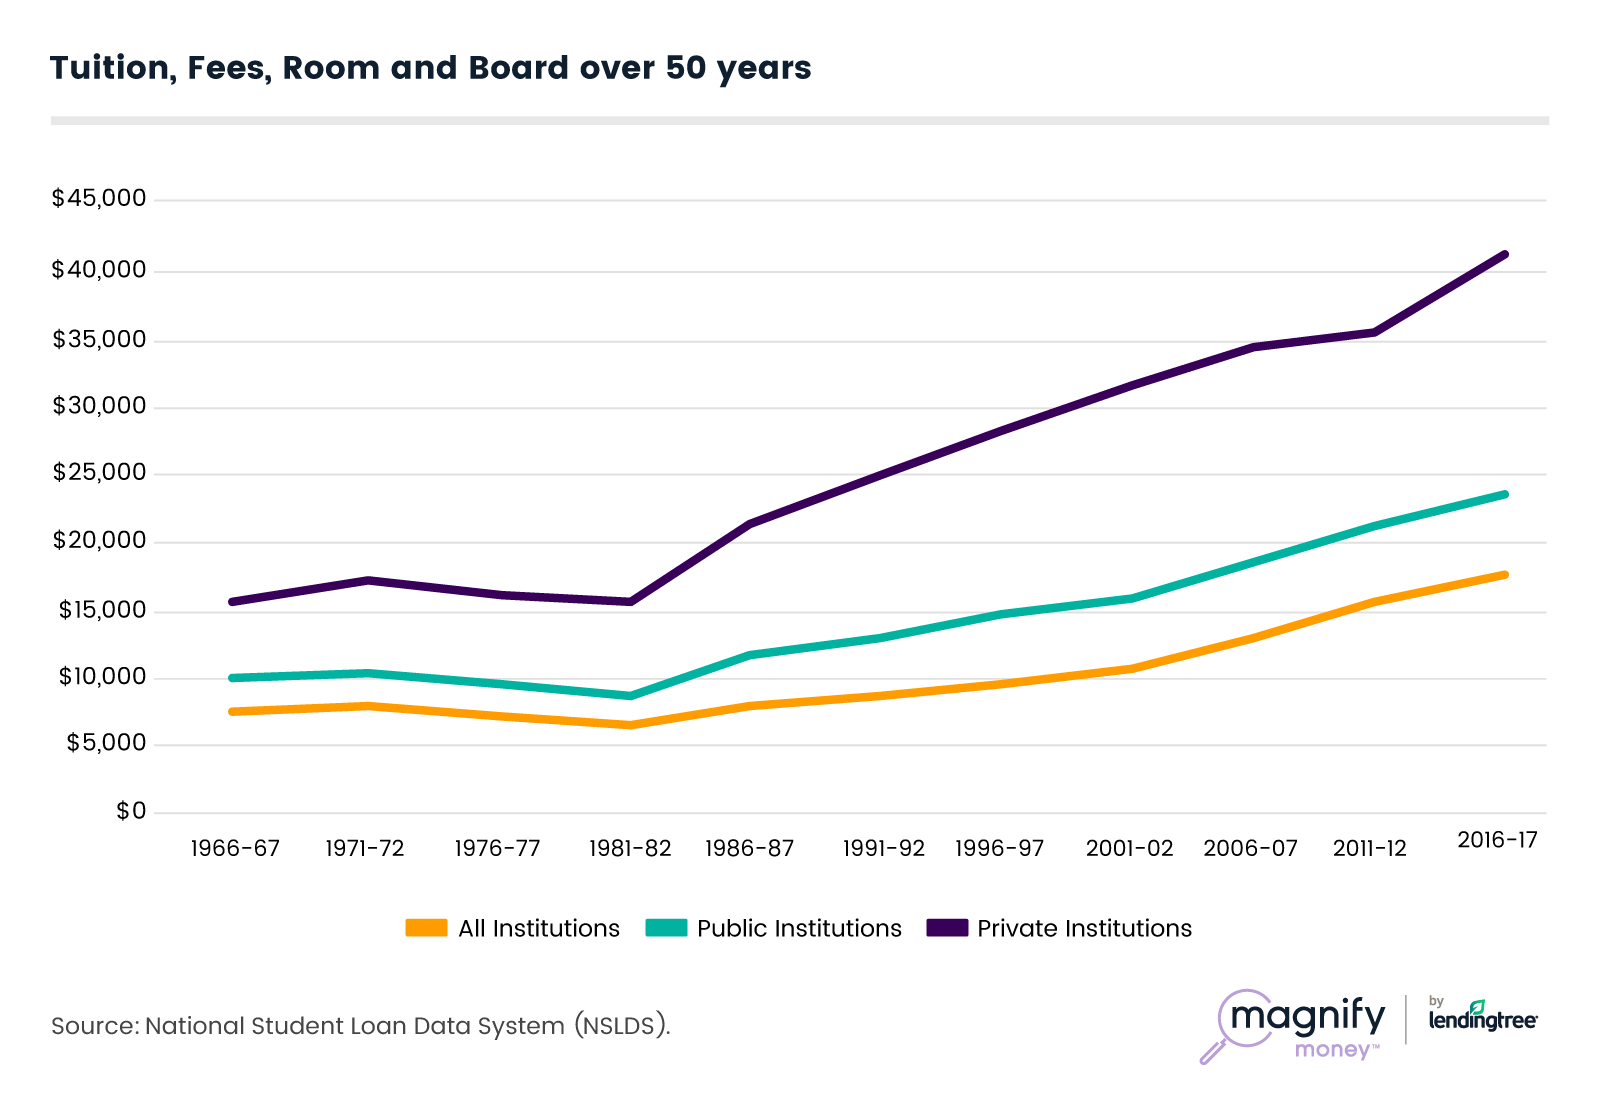
The cost of a college degree has risen much more steeply over the past five decades than overall inflation and wage growth.
Here’s a look at how college prices have changed over the past 50 years. Costs are adjusted for inflation and include room and board, tuition and other related fees.
Student loans are just one form of financial aid that can help pay for a college degree. Gift aid — such as grants from the federal government, state or local organizations or from colleges themselves — can lower a student’s net college price and the need for student loan debt.
But as college costs have increased, student aid awards have not kept up. While most college students receive some form of student aid, just under half (45.7%) of students rely on student loans, borrowing nearly $7,000 a year.
| Institution Type | All Aid | Federal Grants | State/Local Grants | InstitutionaI Grants | Student Loans |
|---|---|---|---|---|---|
| All Institutions | 82.7% | 42.7% | 32.3% | 44.40% | 45.7% |
| Public | 80.2% | 42.3% | 37.3% | 35.6% | 38.2% |
| Nonprofit | 89.6% | 35.2% | 23.8% | 78.7% | 60.9% |
| For-Profit | 86.5% | 69.8% | 8.6% | 25.3% | 74.4% |
Source: The National Center for Education Statistics
The federal government remains the top source of student loan debt, lending far more than states, banks and other institutions. Of the $1.53 trillion in outstanding student debt, $1.38 trillion takes the form of federal student loans.
This college debt has increased by $860 billion since 2007, a sharp difference of 167% in just over 10 years. Meanwhile, the number of people who hold federal student loans has also risen from 28.3 million in 2007 to 42.8 million, a 51% increase.

Next, take a look at how much borrowers owe in federal student debt. The average student loan debt is $32,150 across all types of federal student loans.
But most borrowers owe far less than this, with a majority (57.3%) carrying $20,000 or less in federal student loan debt.
Six-figure student debt is, fortunately, still fairly rare, with just 5.5% of borrowers owing $100,000 or more in federal loans.

Student loan balances also vary by age, with borrowers ages 35 to 49 having the highest average student loan debt, at $37,051. That average then eases for those above 50, but not by that much. And, of course, borrowers who are college-aged (24 or younger) have the smallest balances, since this group includes those still taking out loans for their education.
Overall, borrowers between the ages of 25 to 49 account for the bulk of college debt, with just under a trillion, or $995.1 billion, of outstanding federal student loans.


With balances this high, not all borrowers can keep up with student loan payment. If nine months of nonpayment pass, a federal student loan defaults.
Options such as taking student loan deferment and forbearance or enrolling in income-driven repayment plans can often be effective ways to avoid defaulting. But the data suggest that some borrowers still aren’t taking advantage of these federal student loan benefits.
In 2017, more than 1 in 10 borrowers who had left college in 2014 had since defaulted. Default rates are higher among students leaving two-year colleges and schools with programs shorter than two years.
For-profit colleges also tended to have higher rates of default, compared to public colleges and private nonprofit schools.
| Percentage of people who defaulted since they entered their repayment phases three years ago (2014) | ||||
|---|---|---|---|---|
| All Institutions | 11.5% | |||
| Public | 11.3% | |||
| Nonprofit | 7.4% | |||
| For-profit | 15.5% | |||
| Less-than-2-year institutions | 17.0% | |||
| Public | 13.80% | |||
| Nonprofit | 19.80% | |||
| For-profit | 17.0% | |||
| 2-year institutions | 18.2% | |||
| Public | 18.3% | |||
| Nonprofit | 17.6% | |||
| For-profit | 17.5% | |||
| 4-year institutions | 9.0% | |||
| Public | 7.5% | |||
| Nonprofit | 7.0% | |||
| For-profit | 14.6% | |||
Source: The National Center for Education Statistics
Completing an advanced degree can also mean taking on a significant amount of debt, though here, not all graduate student debt is created equal. For example, 48.2% of research doctorate degree holders have student loan debt, but that proportion is significantly higher — 74.5% — for those with professional doctorate degrees.
Among those with graduate student loan debt, balances range from $50,300 among master’s degree holders up to $171,700 for those with professional doctorates.
Digging a little deeper, the data show that earning an advanced medical degree (such as an MD) comes with the highest levels of debt. Eight in 10 graduates with these degrees have student debt, with average student loan debt balances at $223,100.
Besides federal student loan debt, private student loans from banks and other lenders are also an important piece of the puzzle. The amount of outstanding private student loan debt is $67.1 billion, most of which (88.3%) was borrowed for undergraduate studies.
| Private Loans Outstanding | ||
|---|---|---|
| Q1 2018 | ||
| Current Balance | $67.12 billion | |
| % of Loans for Undergraduate School | 88.3% | |
| % of Loans for Graduate School Source: MeasureOne | 11.7% | |
| Source: MeasureOne | ||
Repayment Status of Private Loans | ||
| Q1 2018 | ||
| Grace | 2.3% | |
| Deferment | 21.1% | |
| Forbearance | 2.5% | |
| Repayment | 74.1% | |
| Source: MeasureOne | ||
Percentage of Payable Private Loans Currently Delinquent | ||
| Q1 2018 | ||
| 30-89 days delinquent | 2.8% | |
| 90+ days delinquent | 1.50% | |
| Charge-offs | 1.80% | |
Source: MeasureOne
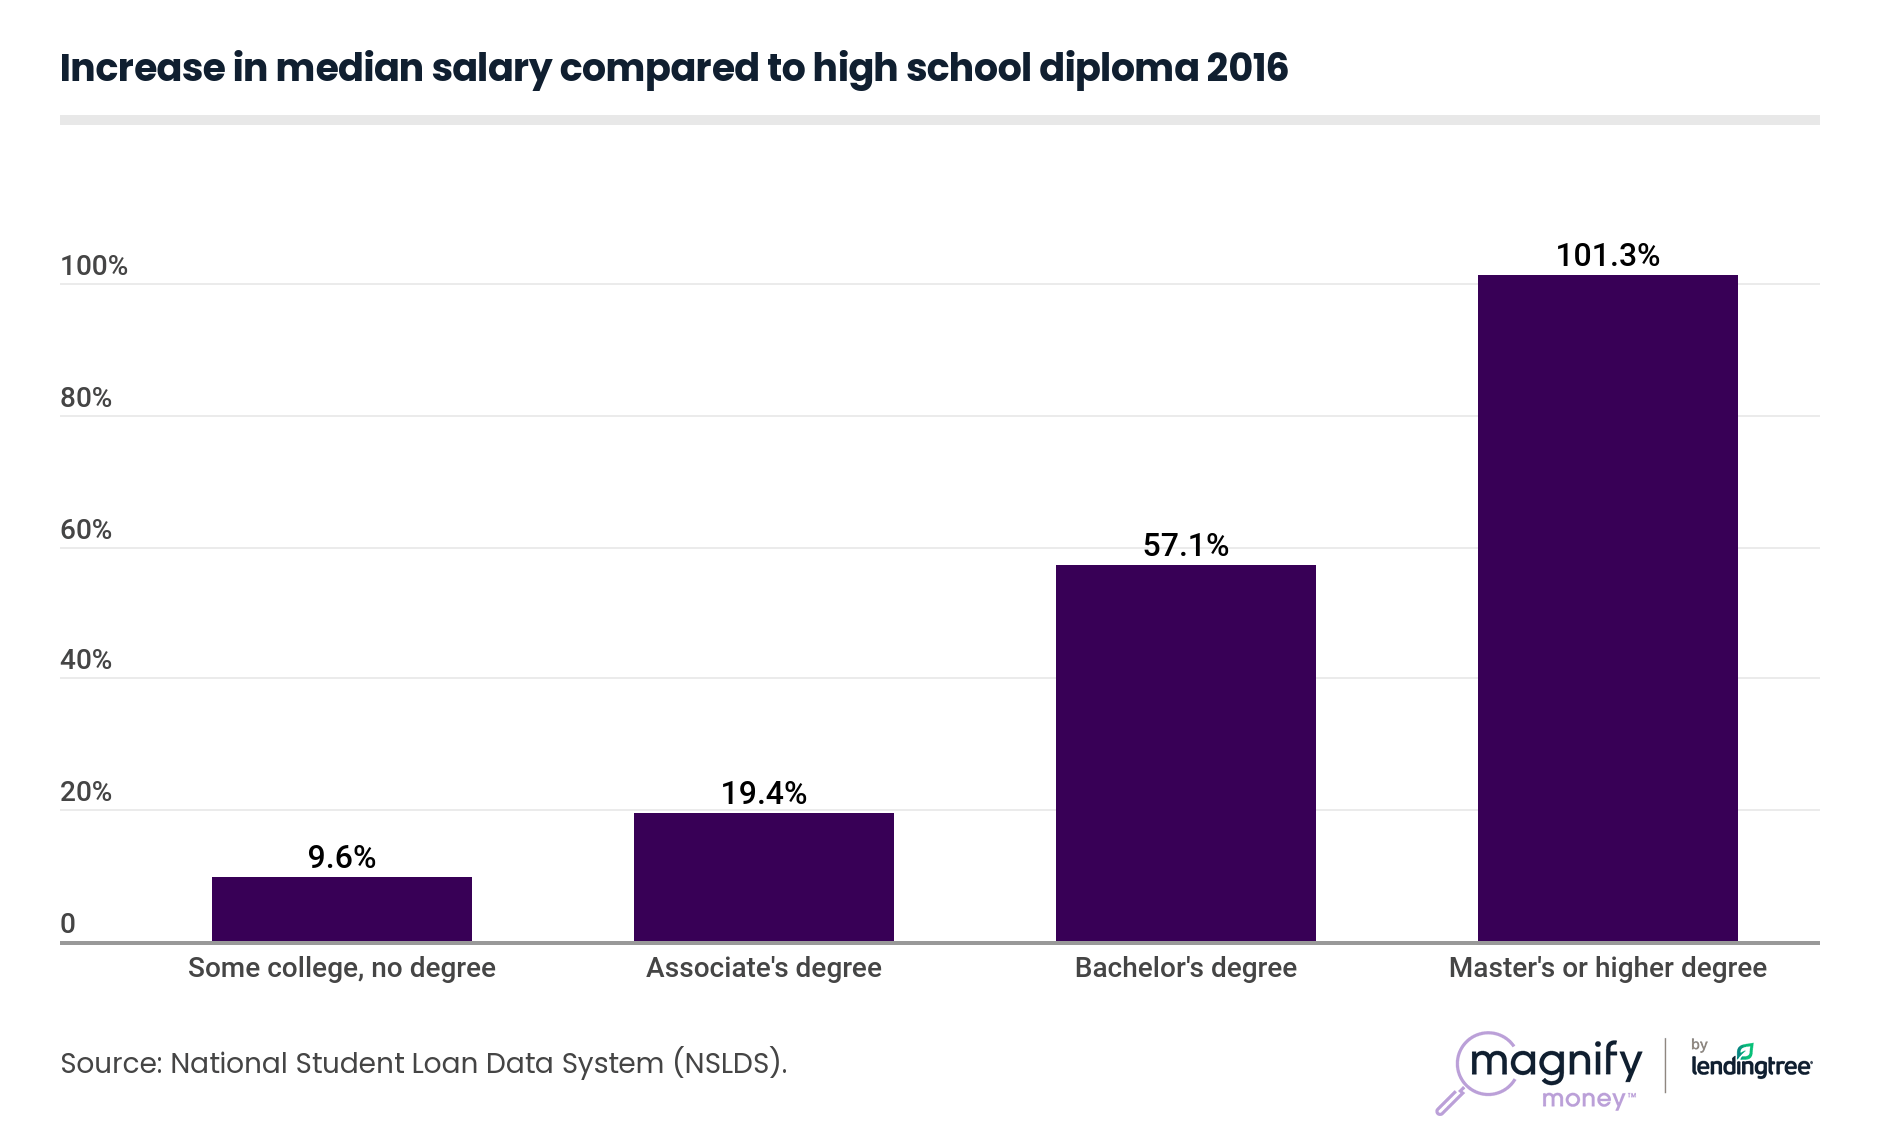
With college costs and average student loan debt levels on the rise, some borrowers might wonder whether their education is worth the price.
Overall, earning one or more degrees does substantially increase income. Someone with a bachelor’s degree earns 57.1% more on average than a worker with only a high school diploma. Those who hold a master’s degree or higher tend to earn twice as much as those with high school diplomas, and 28.2% more than graduates who hold a bachelor’s degree.

Of course, a college graduate’s course of study has a huge impact on their career opportunities and earning potential. Engineering fields offer the highest pay, with median salaries of $69,650 among college graduates. Studying theology and religious studies, on the other hand, resulted in the lowest pay at just $34,420 per year.
| Field of Study | 2016 | |
|---|---|---|
| Agriculture | $44,590 | |
| Architecture | $50,000 | |
| % of Loans for Graduate School Source: MeasureOne | 2016 | |
| Area, ethnic,and civilization studies | $44,260 | |
| Arts, fine and commercial | $39,830 | |
| Fine arts | $36,270 | |
| Commercial art and graphic desisn | $40,300 | |
| Business | $50,360 | |
| Business, general | $50,290 | |
| Accounting | $55,400 | |
| Business management and administration | $48,280 | |
| Marketing and marketing research | $50,200 | |
| Finance | $60,070 | |
| Management information systems and statistics | $59,950 | |
| Business, other and medical administration | $49,600 | |
| Communications and communications technologies | $45,260 | |
| Computer and information systems | $65,440 | |
| Construction/electrical/transportation technologies | $55,310 | |
| Criminal justice and fire protection | $40,990 | |
| Education | $40,240 | |
| General education | $40,270 | |
| Early childhood education | $35,940 | |
| Elementary education | $39,070 | |
| Secondary teacher education | $39,070 | |
| Education,other | $40,050 | |
| Engineering and eneineering-related fields | $69,650 | |
| General engineering | $63,770 | |
| Chemical engneering | $74,880 | |
| Civil engineering | $63,110 | |
| Computer engineering | $78,080 | |
| Electrical engineering | $74,790 | |
| Mechanical engineering | $71,860 | |
| Engineering, other | $65,480 | |
| Engineering technologies | $59,630 | |
| English language and literature | $40,280 | |
| Family and consumer sciences | $37,680 | |
| Health professions | $51,830 | |
| General medical and health services | $50,060 | |
| Nursing | 56,350 | |
| History | $43,430 | |
| Liberal arts and humanities | $40,020 | |
| Linguistics and comparative language and literature | $42,040 | |
| Mathematics | $50,340 | |
| Multi/ interdisciplinary studies | $43,170 | |
| Natural sciences | $45,340 | |
| Biology | $45,330 | |
| Environmental science | $41,000 | |
| Physical sciences | $49,110 | |
| Physical fitness,parks,recreation and leisure | $40,080 | |
| Philosophy and religious studies | $39,810 | |
| Psychology | $40,100 | |
| Publicadm inistration and public policy | $56,460 | |
| Social sciences | $50,310 | |
| Anthropology and archeology | $39,800 | |
| Economics | $60,350 | |
| Geography | $45,210 | |
| lnternational relations | $52,290 | |
| Political science and government | $50,330 | |
| Sociology | $40,030 | |
| Miscellaneous social sciences | $42,190 | |
| Social work and human services | $36,200 | |
| Theology and religious vocations | $34,420 | |
| Other fields | $40,380 | |
| Source: The National Center for Education Statistics | ||
For students who have already taken out student debt, completing their degree could make the difference between easily repaying their loans or ending up in default.
Part-time students are much likelier to drop out of college overall, while for-profit college have the worst attrition rates in terms of types of institutions.

As student loan balances have grown, so has the impact of this debt has on borrowers’ lives. By understanding the numbers underlying the student debt crisis, we can better gauge its effects. Overall, though, a degree is still worth getting despite rising college costs and the amount of debt needed to pay them.
But today’s students and borrowers need to be wiser with their educational and financial choices to avoid the worst outcomes. As the data suggest, the type of school and the field of study can play a big role here.
Statistics can’t always capture individual cases, as one student’s situation won’t necessarily match the averages. But one thing that might hold true for most if not all borrowers is the importance of knowing your options to manage this debt. If you owe student loans, check out to help you get out of being another statistic in the ongoing student debt crisis.
 Elyssa Kirkham
Elyssa Kirkham is a personal finance writer whose work has been featured in TIME, CBS News, MSN Money, Business Insider, Daily Finance and more.
Read More