MagnifyMoney 


A six-figure income may not go as far as you think depending on where you live. After factoring in taxes, debt payment and living expenses like child care and transportation, a family earning $100,000 in certain cities could still find themselves struggling to get by.
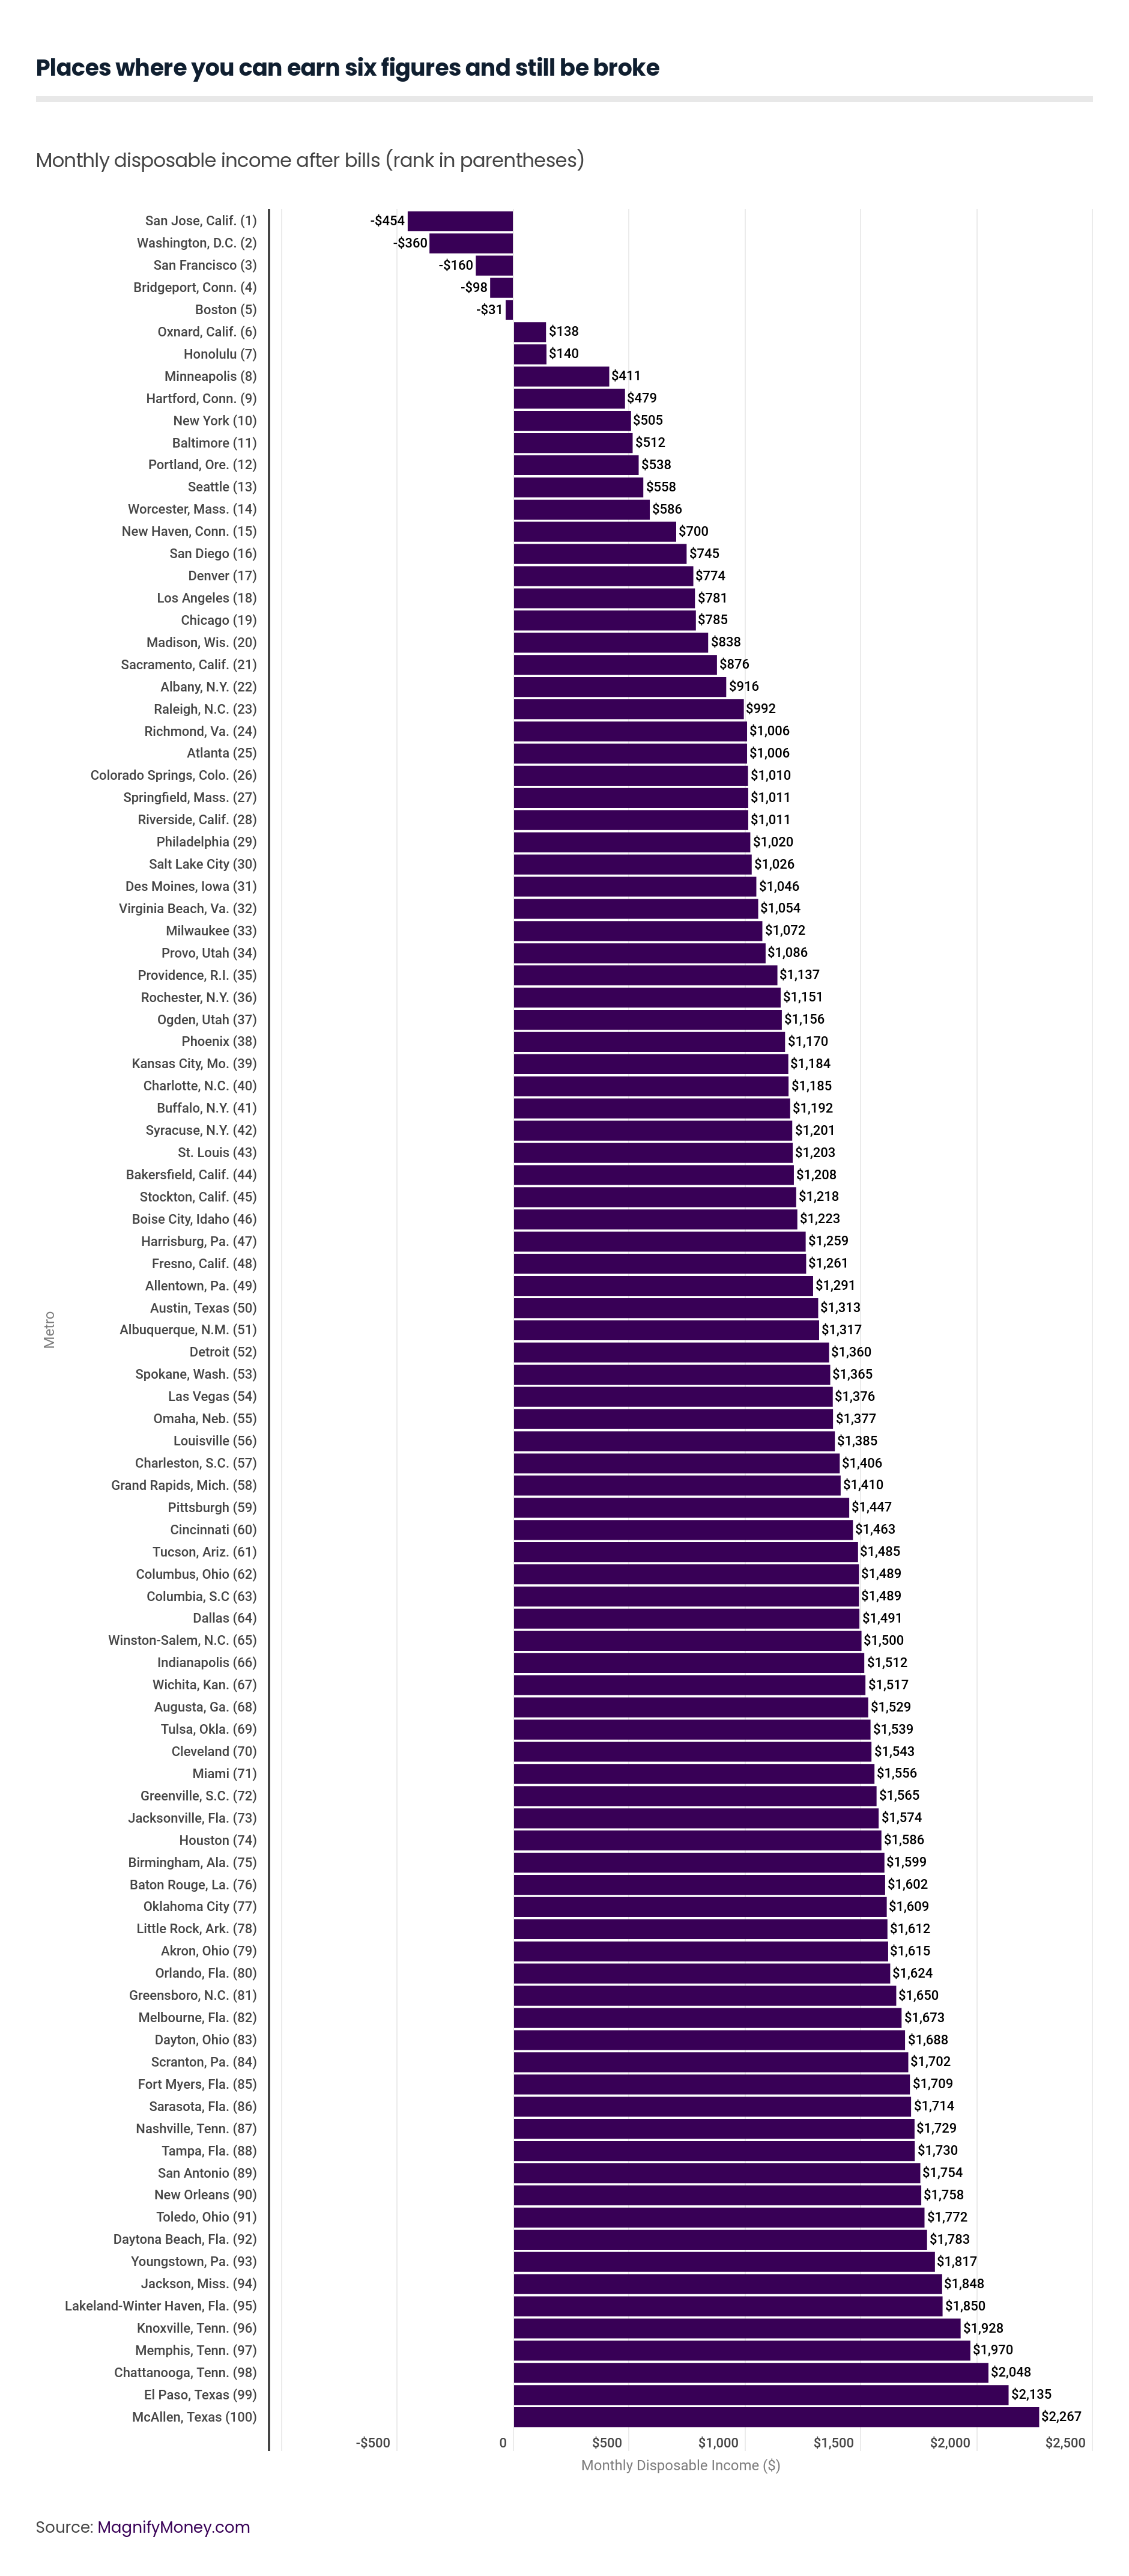
For this study, we created a hypothetical, but fairly typical, couple with one child who earns a combined gross income of $100,000 (or $8,333 monthly). We estimated monthly expenses, debt payments and tax obligations to calculate what the family’s disposable income would be in various metro areas based on the average lifestyle of a six-figure earner in the corresponding metro area. Then, we ranked the locations from places where they would have the most and least disposable income.
The order in this year’s ranking has changed from last year due to changes in living costs like housing, transportation and child care. But you’ll notice many usual suspects on the worst list and some familiar faces on the best list.
There are a few changes to the methodology in our 2018 study. We focused on the largest 100 metros this time around as opposed to some 381 metros last year. We also took a more detailed approach to calculating variables that impact a family’s disposable income. Here are the updates we made:
We based our case study on a family earning a gross income of $8,333 per month. Then we subtracted their monthly expenses, debt obligations and savings to come up with an estimate of how much cash they’d have left over at the end of the month.
Savings. We assumed the family contributed $500 monthly to their 401(k). Last year, we assumed the family set aside 5% of their savings in a regular savings account. This year, we changed the savings to 401(k) contributions because it’s something of a bastion of corporate middle-class personal finance, and it offers a tax benefit.
Tax assumptions. Our study assumes the couple will file jointly for 2018. They took the standard federal deduction and received a federal $2,000 credit for their one child. They also took the standard deductions and credits offered by their state, and took advantage of the pretax DCFSA child savings plan to deduct the $5,000 maximum from their taxable income by their employer. The couple had insurance premiums paid from their pretax income by their employer and their 401(k) contributions paid from their pretax income by their employer.
Debt: We assume the family had a monthly student loan payment of $222, which is the median student loan payment according to the Federal Reserve. Housing and auto debt are bundled in with the housing and transportation cost budget line items in monthly expenses.
Monthly expenses. We based monthly expenses — housing, transportation, food, utilities, household operations, child care and entertainment — for each location on data taken from the Bureau of Labor Statistics, the Department of Housing and Urban Development, Care.com, Kaiser Family Foundation and the Federal Reserve. We calculated an average for these expenses taking into account the lifestyle costs of a six-figure earner.
Compared with last year, we beefed up the monthly necessity expenses — although by no means hit them all — by adding costs like household operations costs and utilities to get a more realistic sense of how much people would have left over after paying their basic bills. We also added health insurance since it’s one of the most basic expenses.
Read the full methodology here.
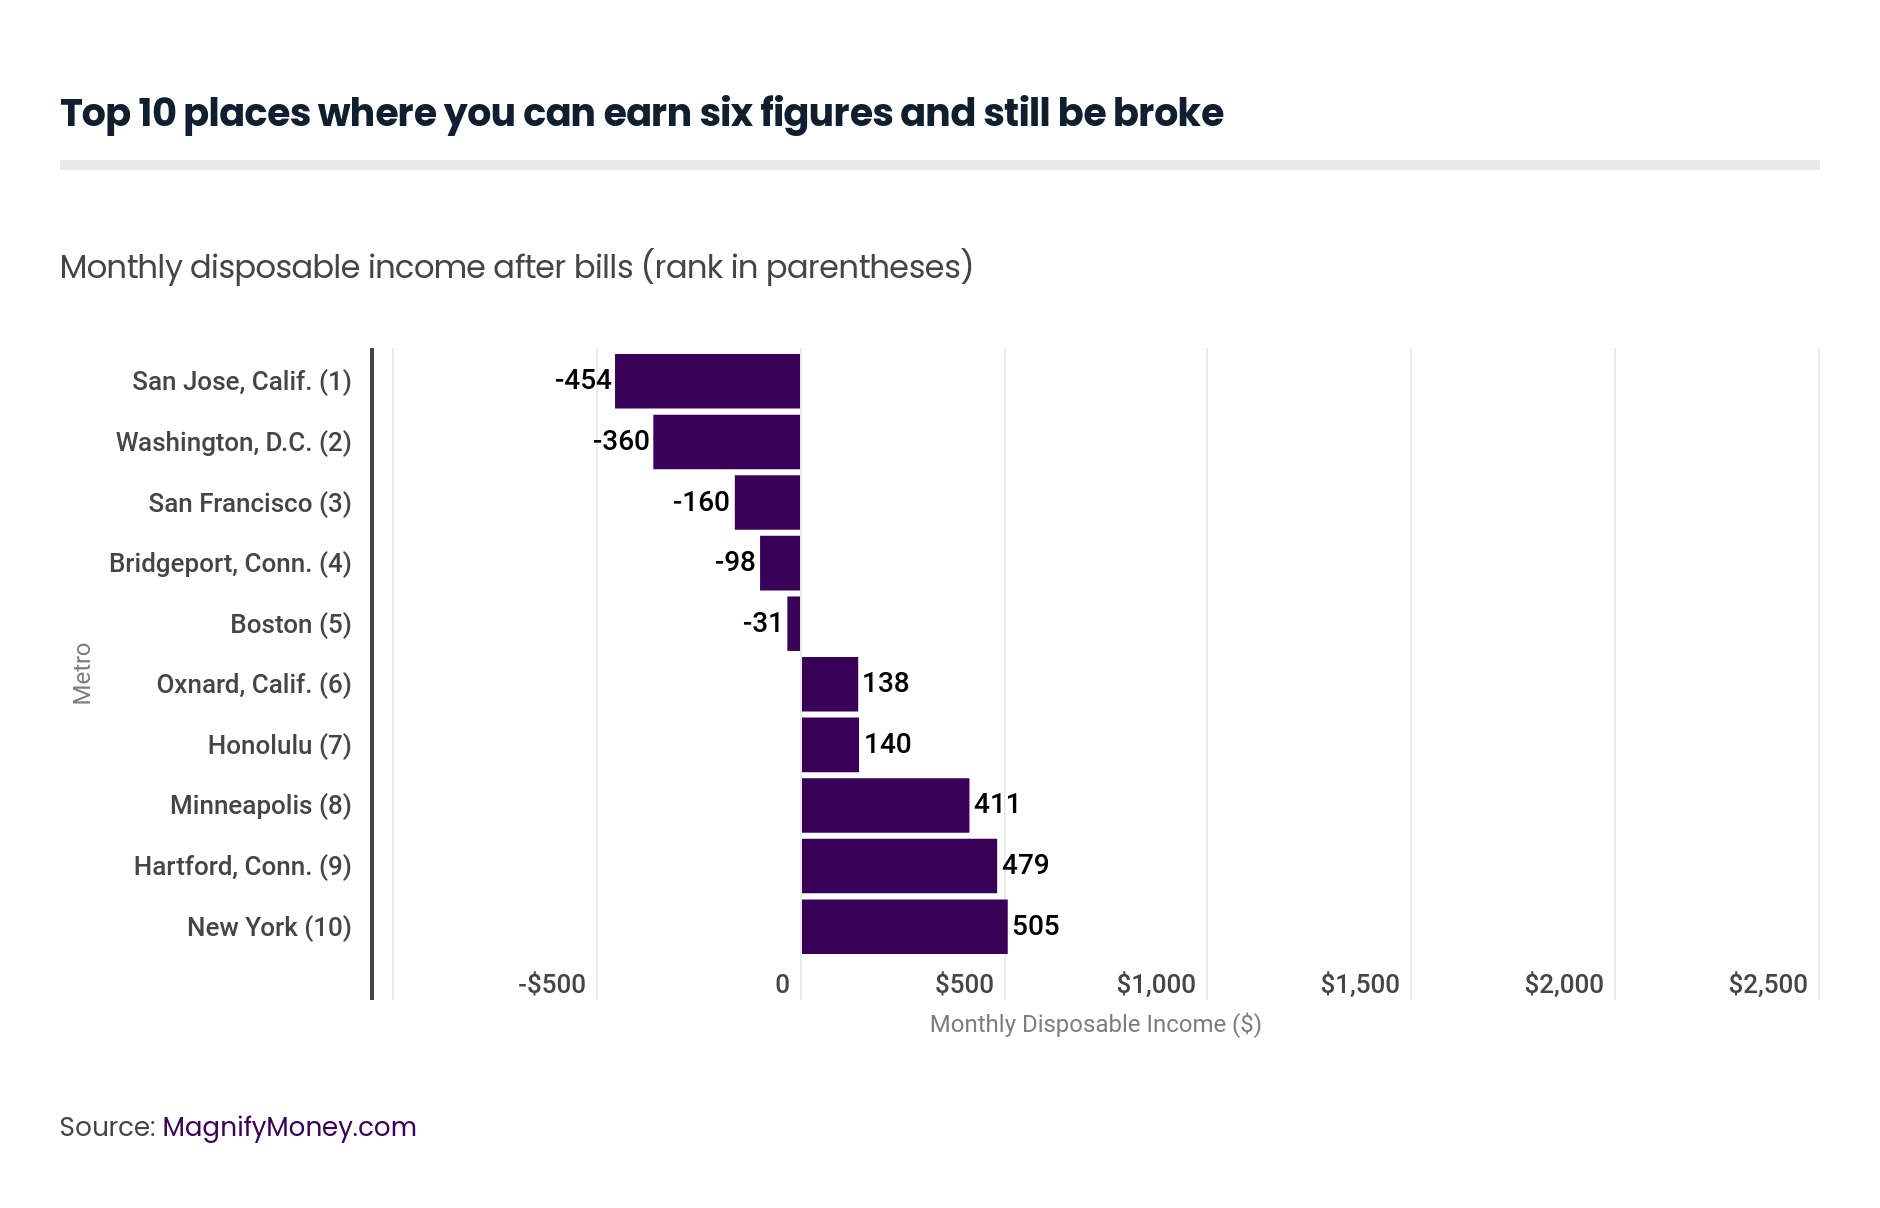
San Jose, Calif., moves up to the top spot replacing Washington D.C. from last year’s study. San Jose is the location where a combined income of $100,000 is going to offer the least amount of security for our hypothetical family of three.
To make ends meet, they would need to either dip into savings or rely on credit cards to cover the $454 budget deficit. Housing in this area decreased compared with last year ($2,916 in 2017 versus $2,520 in 2018). However, an 84% increase on child care costs and 30% increase on transportation costs takes the location to the no. 1 spot. This year, we used a different source for child care costs, which could also contribute to the increase in cost.
Washington D.C. comes in at a close second leaving the family $360 in the hole each month. Housing costs increased to $2,597 compared with $2,274 in 2017. This is the most expensive metro area to find living arrangements. The general rule of thumb is to not spend more than 30% of your gross income on housing, but this recommendation could leave you house poor since it doesn’t consider your net income.
In this case, housing takes up about 31% of the couple’s gross income ($8,333 per month). However, housing takes up 47% of the family’s actual paycheck after subtracting taxes, FICA, 401(k), health insurance and the pre-tax child care saving incentive. Couple the housing costs with the transportation expense ($1,302), and a six-figure earning family can really struggle to live comfortably in and around the nation’s capital.
San Francisco is about 50 miles away from San Jose (no. 1 on the list), but offers slightly lower living costs, which makes the $100,000 income go a bit further. The two cities share almost the exact same monthly expenses. It’s the $320 total saved on housing and transportation that makes San Francisco slightly more affordable than the San Jose metro area. San Francisco made it to no. 4 last year, so it’s no surprise we’re seeing it again this year taking one of the top spots.
The Bridgeport, Conn., area offers some opportunity for savings in food and child care costs, but estimated utilities and transportation costs come in higher than even the top three worst places for six-figure earners. Our hypothetical family would spend almost 29%* of their paycheck on transportation and utilities alone.
Boston has the third highest cost of child care to make the list. Child care could take up a whopping 15%* of a family’s paycheck after subtracting taxes and savings contributions. Just like last year, housing is another budget buster in the Boston area eating away another 37% of their paycheck.
Oxnard, Calif., is a new addition to the list this year, and the first metro area that doesn’t leave a $100,000 earning household in the red each month after taxes, investment contributions and expenses.
With that said, disposable income of just $138 isn’t much to write home about. An unexpected expense could easily wipe out their spare cash. Like the other California locales above, housing takes a huge bite out of their budget — almost 38% of net income.
Honolulu gives the family more disposable income than Oxnard, Calif., but just barely. When all expenses are covered, the family has $140 left over to spare, which is less than last year’s disposable income of $302. Year over year, child care and transportation costs increased by 30% and 23% respectively, but housing decreased by almost 18%.
State income tax is one of several reasons the Minneapolis area makes the list. The estimated state tax here ($506) is higher than the top two worst places — San Jose ($206 state tax) and Washington, D.C. ($366 state tax). Housing takes up about 37% of the family’s paycheck, which isn’t ideal but less than other locations.
Hartford, Conn., is another new addition to the list. Hartford offers $339 in disposable income which is more than double that of Honolulu. Housing in Hartford is the second lowest of this list taking up just 33% of the family’s paycheck.
The New York metro area came in no. 5 last year, but takes spot no. 10 for 2018. It may come as a shock that it’s not closer to the top, but major savings in transportation contributes to a disposable income of $505 after bills and other responsibilities.
For a comparison, the other “worst places to live” have monthly transportation costs ranging from $1,200 to $1,400. The estimate for transportation costs in the New York area is just $997 per month.
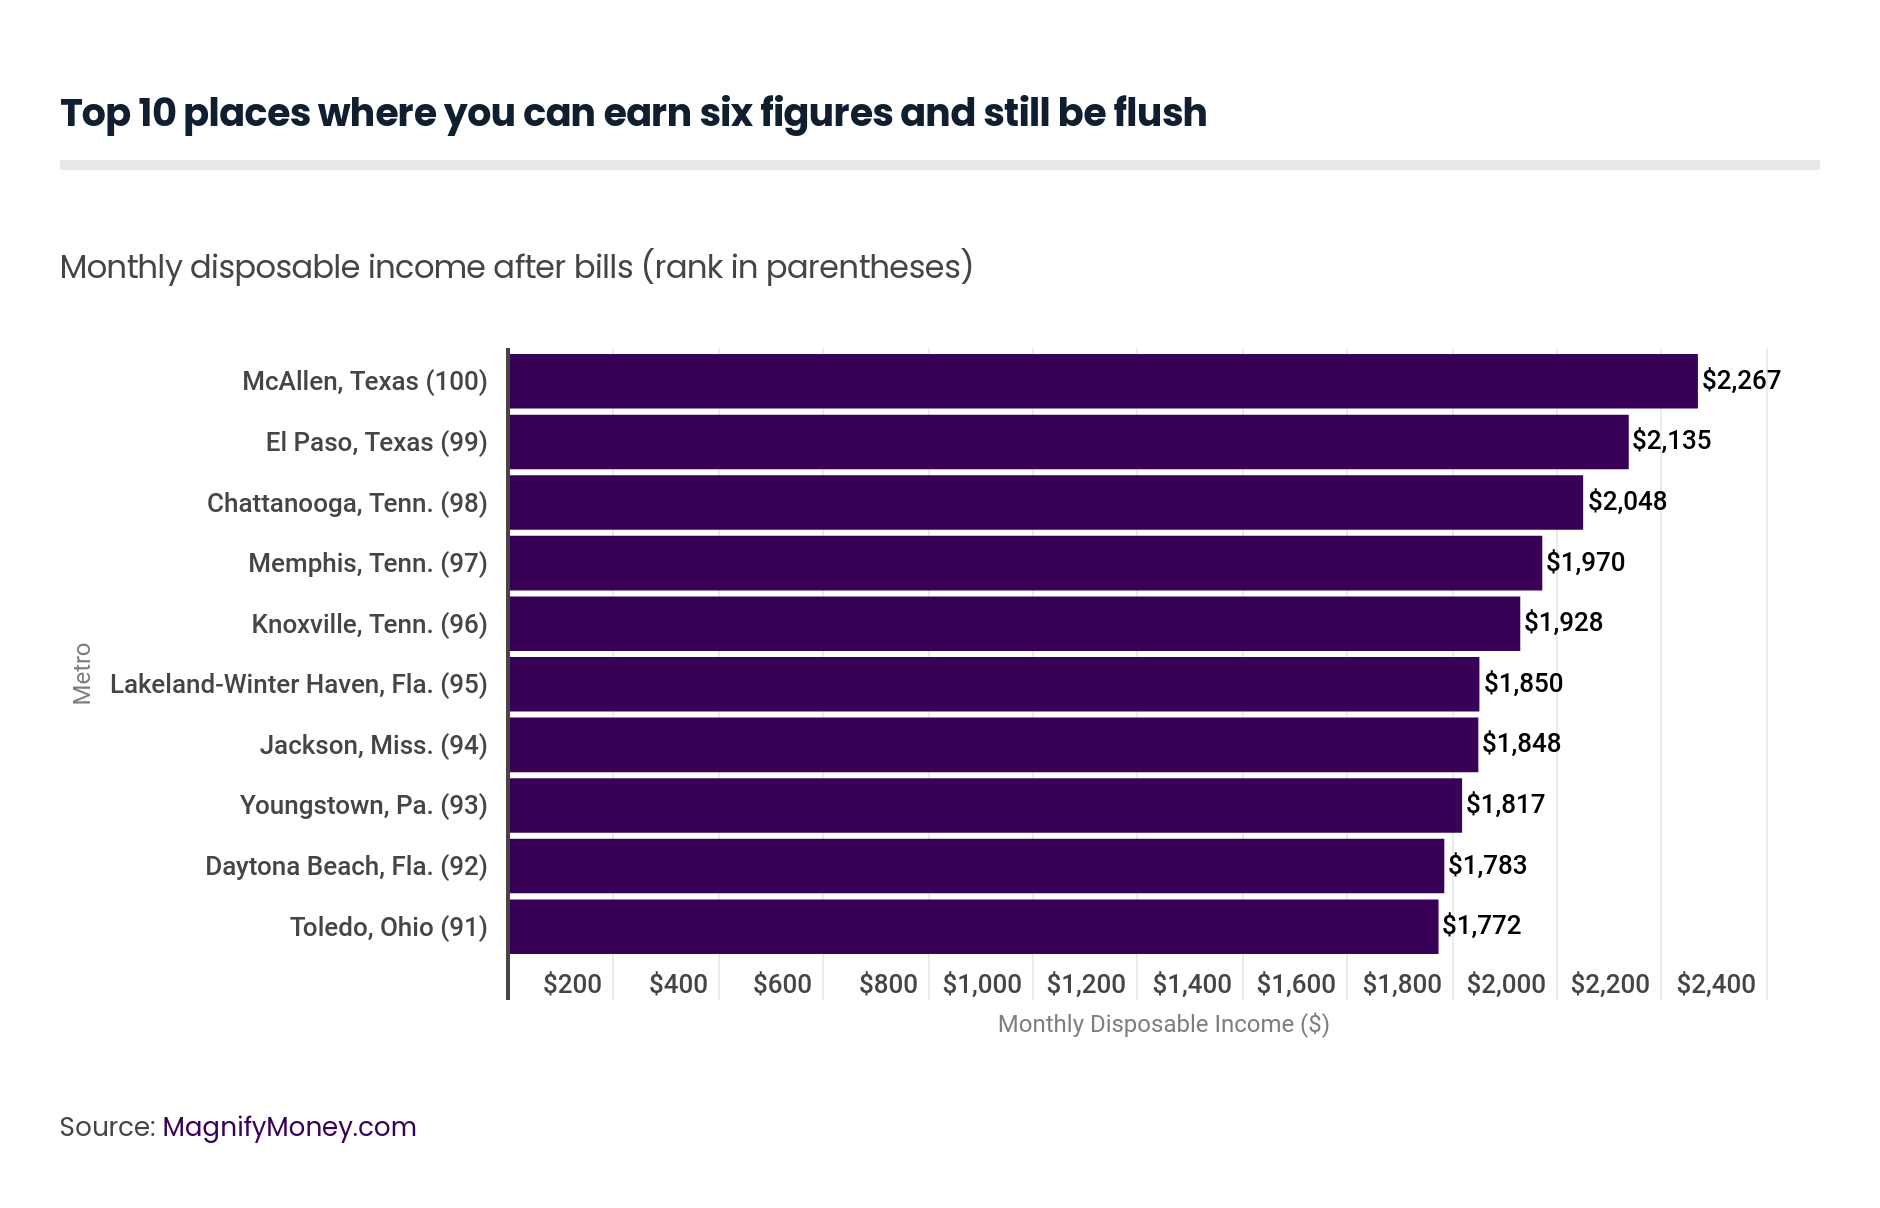
It’s no surprise that states without state income tax make the top of the list for best places to make six-figures. McAllen also has a remarkably low monthly housing cost ($889). Last year, housing costs for McAllen were sitting at $1,086 contributing to its no. 5 ranking on the best list.
Here, the family has a nice $2,267 per month in disposable income. This surplus in cash can offer plenty of flexibility to save, invest or tackle lingering debt. Overall, household bills take up just 62%* of the paycheck in McAllen. In comparison, for San Jose, the worst metro area for six-figure earners, bills take up 108%* of the paycheck.
El Paso, Texas, has a slightly higher housing cost than McAllen ($1,060 versus McAllen’s $889). In El Paso, the hypothetical family gets a disposable income of $2,135, again, enough to comfortably stash some cash away for a rainy day while keeping current on bills.
Chattanooga, Tenn., offers low child care and health insurance, but comes in third with a disposable income of $2,048 thanks to the higher housing cost ($1,116) and transportation cost ($1,186) . These two major living expenses are higher than McAllen and El Paso, but when combined still only take up 39% of net income.
Memphis has higher housing costs than the locations above but more affordable child care. Child care ($622 per month) is lower than even the two best metro areas — McAllen and El Paso (both $686 per month). The family gets a disposable income of $1,970, which is a respectable sum.
Knoxville, Tenn., is yet another southern metro area in a state with no income tax. Housing and child care costs put Knoxville behind Chattanooga and Memphis. But together, housing and child care costs, two big ticket budget line items, only eat up about 31% of the household’s paycheck.
The monthly disposable income at Lakeland-Winter Haven, Fla., clocks in at $1,850. The health care costs ($525) are considerably higher here when compared with other cities even the most expensive places for six-figure earners. San Jose, Calif., and Washington, D.C., have health care costs of $402 and $456, respectively.
Jackson, Miss., is the first locale on the best places to live list that has a state income tax. Jackson offers a disposable income that’s just two dollars shy of Lakeland-Winter Haven, Fla. at $1,848. Despite the state tax, housing ($1,082 per month) and child care ($514 per month), it’s still an affordable place to call home for six-figure earners.
Youngstown, Pa., is the only location representing the Northeastern states in this list. Child care is high ($694) compared with other states that have affordable living. But housing and transportation costs are comparable with other locales, and health care is noticeably lower at $331 per month.
Daytona Beach, Fla., is in a no-income tax state but has high housing, transportation and food costs, which takes it down a few pegs even below two states that have state taxes. Bills take up 70%* of net income.
Toledo, Ohio, rounds out the top ten best places for six-figure income households. Like, Youngstown, Pa., Toledo has high child care costs ($694 per month) when compared with the other affordable locations. Food and entertainment costs can also put some pressure on the purse strings. But overall, the household will pay just 70%* of their paycheck on household expenses.
*These numbers have been corrected due to an editing error.
**Due to a data collection error, the health insurance costs for Minneapolis were incorrectly calculated. We have updated the ranking for Minneapolis from #5 to #8.
The hypothetical family we created is a typical one that earns a combined income of $100,000 (the median income for a married-couple family in 2016 was $81,917, and 39% of such couples earned at least $100,000 that same year).
We were pretty conservative about the couple’s financial and debt obligations by making the following assumptions:
To calculate federal and state taxes, we assumed the following:
The following variables were used to create their hypothetical expenses (each is the average cost for the geography indicated in parentheses):
Sources include the Bureau of Labor Statistics; the Department of Housing and Urban Development; the Tax Foundation; Care.com; the Kaiser Family Foundation; the U.S. Federal Reserve; and the U.S. Census Bureau.
 Taylor Medine
Taylor Medine is a freelance writer who's covered all things personal finance for the last seven years. Her bylines have appeared on The Balance, Experian, Credit Karma, Business Insider, and much more.
Read More Kali McFadden
Kali McFadden is a senior research analyst at LendingTree and MagnifyMoney based in Charlotte, N.C., where she conducts data-driven studies of issues related to personal finance and economics.
Read More