MagnifyMoney 


A household bringing in $100,000 each year should be on firm financial footing. But depending on where you live, that amount might be barely enough to scrape by — or might not even be enough to cover the basics. Taxes, housing, transportation and other typical expenses can easily eat up six figures a year in certain cities, leaving families strapped for cash, according to a recent analysis by MagnifyMoney.
For this study, we looked at data from the U.S. Department of Housing and Urban Development (HUD)’s Location Affordability Index (updated in March 2019), which also uses data from the 2012-2016 American Community Survey, to see which cities would leave a dual-professional households earning $100,000 with little to no disposable income. We considered the average cost of housing (e.g. insurance and taxes), transportation (e.g. car payments, parking, tolls, bus fare, etc.), childcare, food, retirement contributions, utilities and other line items in a typical family’s budget.
After tallying up all of the expenses, we were able to calculate the disposable income of families living a typical six-figure lifestyle in various metro areas around the United States. Then, we ranked the top cities where families earning $100,000 a year would have the least (and most) amount of money leftover at the end of the month. Here’s what we learned.
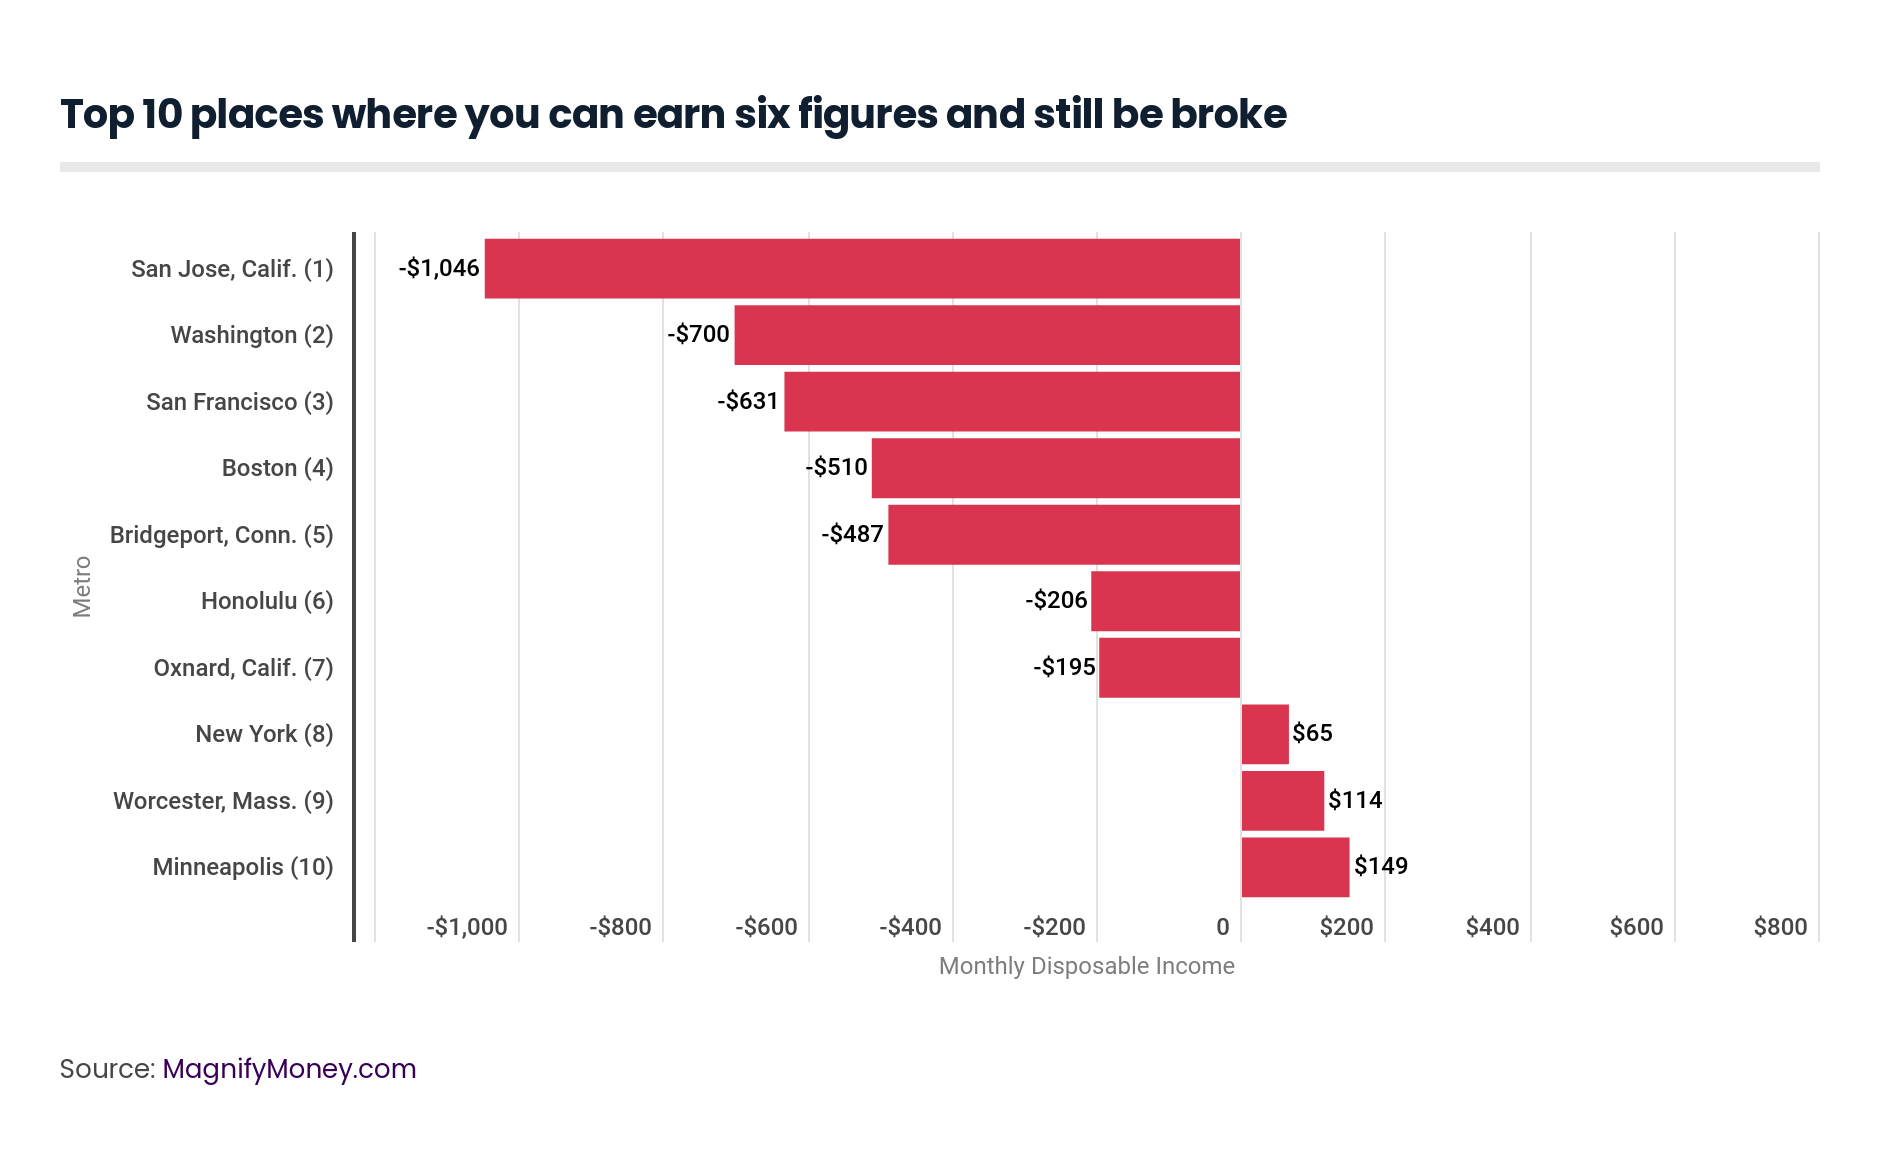
Although rising incomes are outpacing housing cost increases, according to one of our previous studies, families in certain metros are continuing to struggle to make ends meet — even after pulling six figures. In seven of the 10 worst cities in the U.S. to make six figures, a household income of $100,000 isn’t enough to cover basic expenses.
For example, in Oxnard, Calif., a coastal city in Southern California, families need to scrounge up another $195 to break even each month. Meanwhile, those in the northern California city of San Jose have a whopping total of $1,046 in unmet expenses each month.
Things get slightly better as families head east. Those in the Big Apple have about $65 in disposable income each month (not even enough for the average Broadway show ticket). But families making $100,000 a year in Minneapolis have an extra $149 to play with after expenses, so at least not all Minnesota families are doomed after making six figures.
Breaking down the expenses by line item can give you a sense of what’s costing families the most in these metros.
The majority of household budgets is devoted to housing, transportation and childcare. Housing was the single largest expense in the top 10 places where you can earn six figures and still be broke, with families in San Jose, Calif., paying the most ($2,760 each month) and families in Worcester, Mass., paying the least ($1,779). Transportation ate up the second largest portion of the budget, ranging from $1,082 to $1,532 depending on the city, with childcare costing slightly less.
Everything’s bigger in Texas — including the amount of disposable monthly income for families making $100,000 a year. In McAllen, a city along the state’s southern border, households have $1,795 left in their bank accounts after covering basic expenses; meanwhile, families in the western city of El Paso have just slightly less ($1,679) to spend at the end of the month.
Cities in Florida took third and fourth place, followed by Tennessee metros in fifth, sixth and eighth place. No city in our list of the top 10 places where you can earn six figures and still be flush left families with a surplus of less than $1,400.

A relatively low cost of housing helps families keep more money in their pockets in the best places to make six figures; none of the average households in the top 10 metros spent more than $1,299 to keep a roof over their heads. Families in McAllen, Texas, barely pay more than four figures for housing, which costs $1,004 a month on average.
Seven of the top cities are in places with no state income tax, giving families another roughly $200 to $400 to play with each month, compared with those in the worst cities for families earning $100,000. Childcare was also significantly less in these cities, ranging from $514 to $694 a month, roughly half (or less) of what families making $100,000 pay in the most expensive city, San Jose, Calif.
Check out the full rankings of the 100 places where you can earn six figures and still be broke (or flush).
For the most part, the percentage of the population that makes over $100,000 in these cities inversely correlates with the average amount of disposable income those families have. None of the average families making $100,000 in these 100 cities saw housing or transportation fall below four figures, making those categories the most significant line items in everyone’s budgets.
Overall, families on the East Coast and West Coast tended to have less disposable income than households in other parts of the country.
There are a few changes to the methodology in our 2019 study. We focused on the largest 100 metros this time around as opposed to some 381 metros last year. We also took a more detailed approach to calculating variables that impact a family’s disposable income.
We based our case study on a family earning a gross income of $8,333 per month. Then we subtracted their monthly expenses, debt obligations and savings to come up with an estimate of how much cash they’d have left over at the end of the month.
These are the assumptions we made for this study:
Savings. We assumed the family contributed $500 monthly to their 401(k). In previous years, we assumed the family set aside 5% of their savings in a regular savings account. This year, we changed the savings to 401(k) contributions because it’s something of a bastion of corporate middle-class personal finance, and it offers a tax benefit.
Tax assumptions. Our study assumes the couple will file jointly for 2019. They took the standard federal deduction and received a federal $2,000 credit for their one child. They also took the standard deductions and credits offered by their state, and took advantage of the pretax Dependent Care FSA child savings plan to deduct the $5,000 maximum from their taxable income by their employer. The couple had insurance premiums paid from their pretax income by their employer and their 401(k) contributions paid from their pretax income by their employer.
Debt. We assume the family had a monthly student loan payment of $393 — the median student loan payment according to the Federal Reserve — in order to be consistent with the other metrics (which also look at the mean). Housing and auto debt are bundled in with the housing and transportation cost budget line items in monthly expenses.
Monthly expenses. We based monthly expenses — housing, transportation, food, utilities, household operations, child care and entertainment — for each location on data taken from the Bureau of Labor Statistics, the Department of Housing and Urban Development, Care.com, Kaiser Family Foundation and the Federal Reserve. We calculated an average for these expenses taking into account the lifestyle costs of a six-figure earner. We also removed entertainment and combined household expenses with housekeeping supplies and apparel. The cost of apparel is the average amount for a woman, man and child under the age of 2 in each metro.
Compared with last year, we beefed up the monthly necessity expenses — although by no means hit them all — by adding costs like household operations costs and utilities to get a more realistic sense of how much people would have left over after paying their basic bills.
Unfortunately, we haven’t located updated childcare costs compared to last year, so that remains the same in our numbers, but is likely to have increased. We’ve also added the average (mean) income for married couples in each metro, as well as the percentage of married couples in each metro with incomes over $100K.
Further, while the median cost of each expense would have painted a more accurate picture of what half the population experiences, this data only included the average, or mean, of the metrics, so the results may overstate what typical people earn and pay, especially for housing and transportation. With that being said, we recognize we may be lowballing some expenses a typical family faces. For example, our data on health insurance includes monthly premiums, but not copays for visits to the doctor and the cost of prescription drugs.
The hypothetical family we created is a typical one that earns a combined income of $100,000 (the average income for a married-couple family in 2017 was $110,786 (the median was $85,031), and 41% of such couples earned at least $100,000 that same year).
We were conservative about the couple’s financial and debt obligations by making the following assumptions:
To calculate federal and state taxes, we assumed the following:
The following variables were used to create their hypothetical expenses (each is the average cost for the geography indicated in parentheses):
Sources include the Bureau of Labor Statistics; the Department of Housing and Urban Development; the Tax Foundation; Care.com; the Kaiser Family Foundation; the U.S. Federal Reserve; and the U.S. Census Bureau.
 Joni Sweet
Joni Sweet is a freelance writer who helps people take control of their money. Her work has been published by National Geographic, Forbes, Real Simple, The Christian Science Monitor, Huffington Post and other publications.
Read More