MagnifyMoney 

Retirement doesn’t have to mean moving away from a city you love or giving up the cultural opportunities bigger metros provide that can make your retirement years golden.
Aging in place is a growing phenomenon, as many seniors plan to stay in their own homes and remain active members of their communities rather than move elsewhere. But other retirees may still feel the urge for new scenery and a new zip code, whether to lower their cost of living as they adjust to life on a fixed income, or to find a new home that better fits their lifestyle or health care needs.
At MagnifyMoney, we decided to look at which of the 50 largest metros offer the best opportunities for senior citizens in terms of lifestyle, cost of living, medical care and — when the time comes — both in-home and residential assisted care.
Aging in place simply means living in one’s own home (possibly in a continuing care retirement community) independently for as long as possible. In a 2017 AARP survey, senior citizens consistently expressed a preference for living “in their homes and community-at-large”.
As the monumental baby-boomer generation tips into old age, communities, policy makers and other institutions have started to focus their attention on creating environments to increase the likelihood of successfully aging in place.
One big bright spot is the availability of technology to assist people with certain vital tasks, such as taking medicines, keeping track of lists and contacting medical providers for nonemergency consultations.
Seniors can access transportation from anywhere with apps like Uber and Lyft, shop for groceries from their computers and use smart speakers if the keypads on their phones become challenging, access smart-home features (like changing the thermostat) or even call for help in an emergency. Wearable health monitors including fall alerts, mean that family and medical professionals can be immediately alerted if any concerns arise.
With that in mind, we were especially mindful of local metrics that would help people age in place, such as lower costs of living, community engagement and the availability and quality of assisted care.
We used four major categories to make our determinations of which of the biggest 50 US metros were the best places to spend one’s golden years.
Lifestyle:
Cost of living:
Medical quality and cost:
The availability and quality of different kinds of assisted care:
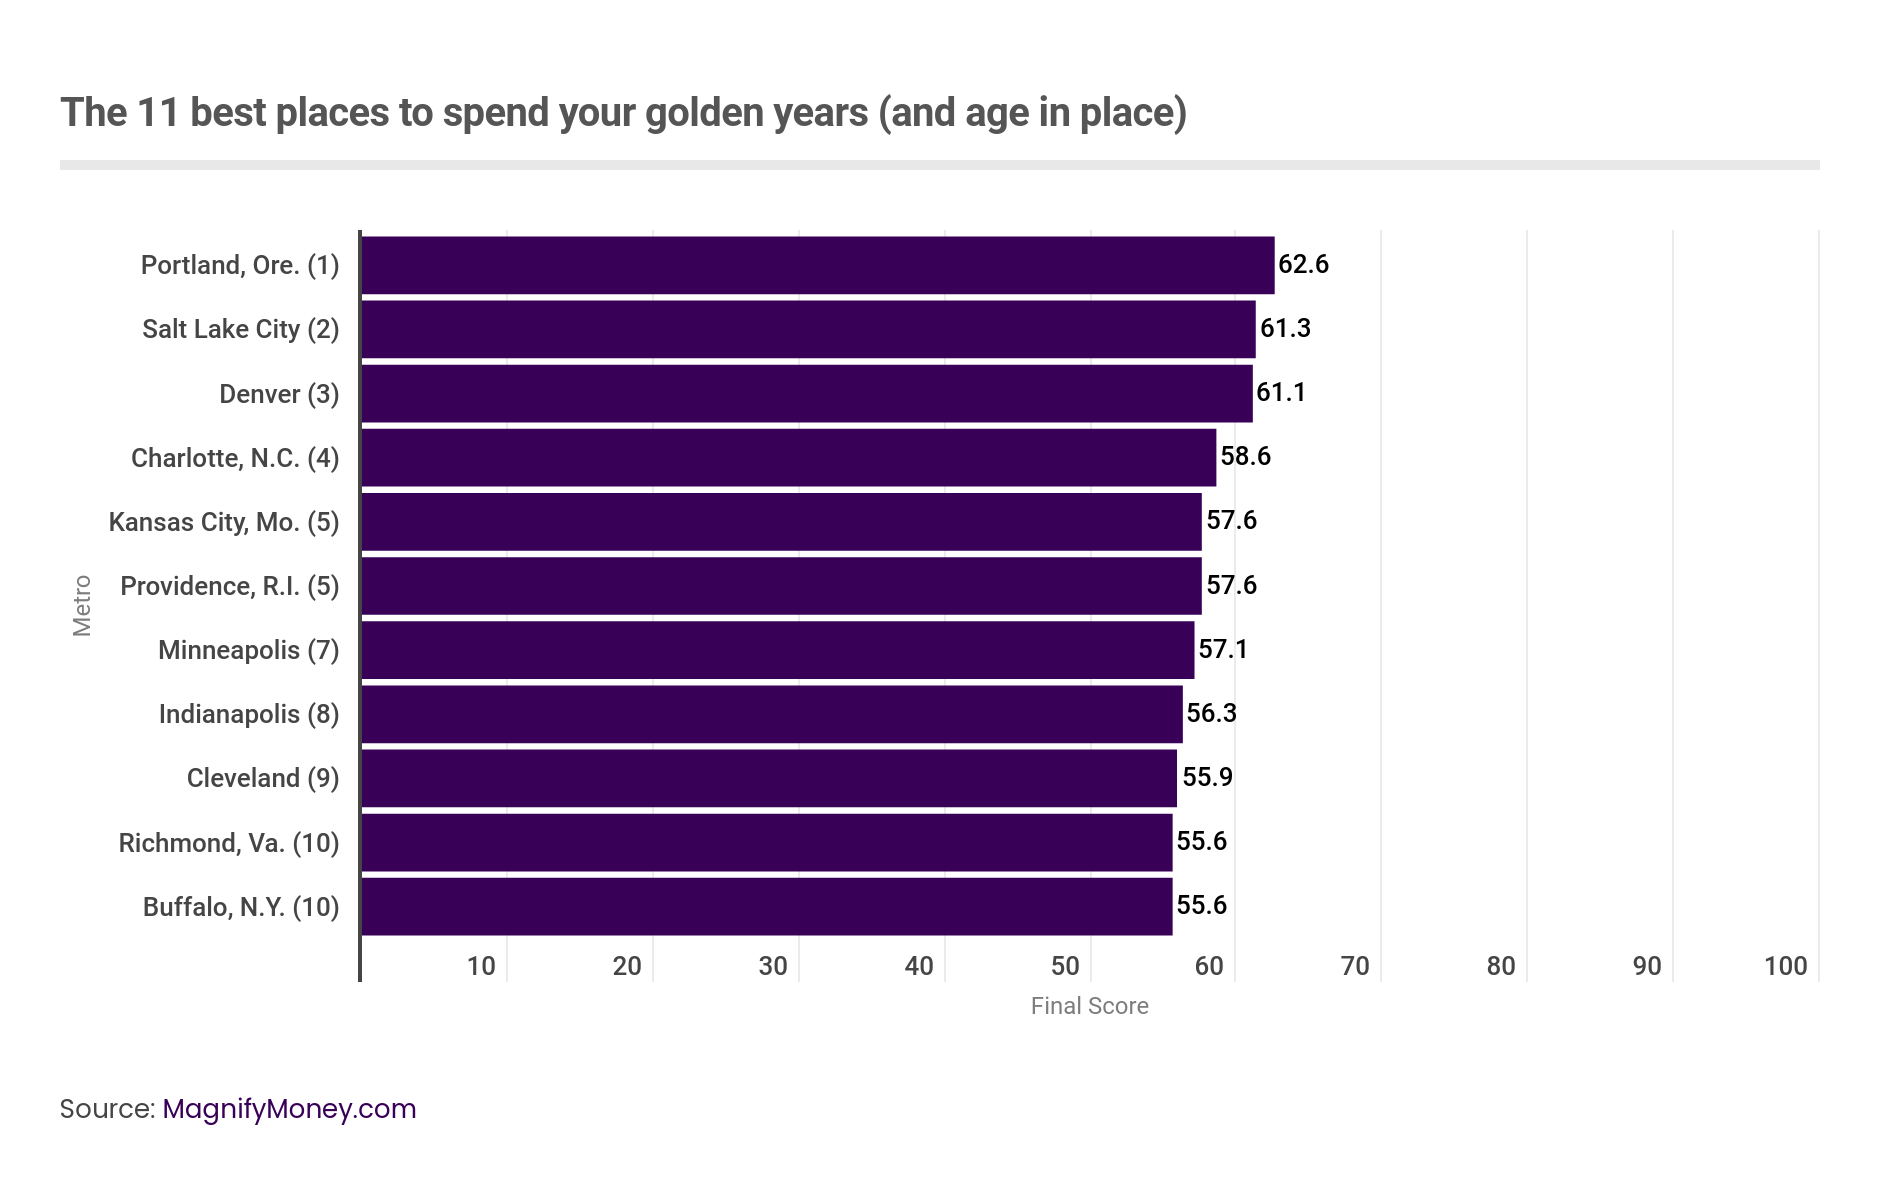
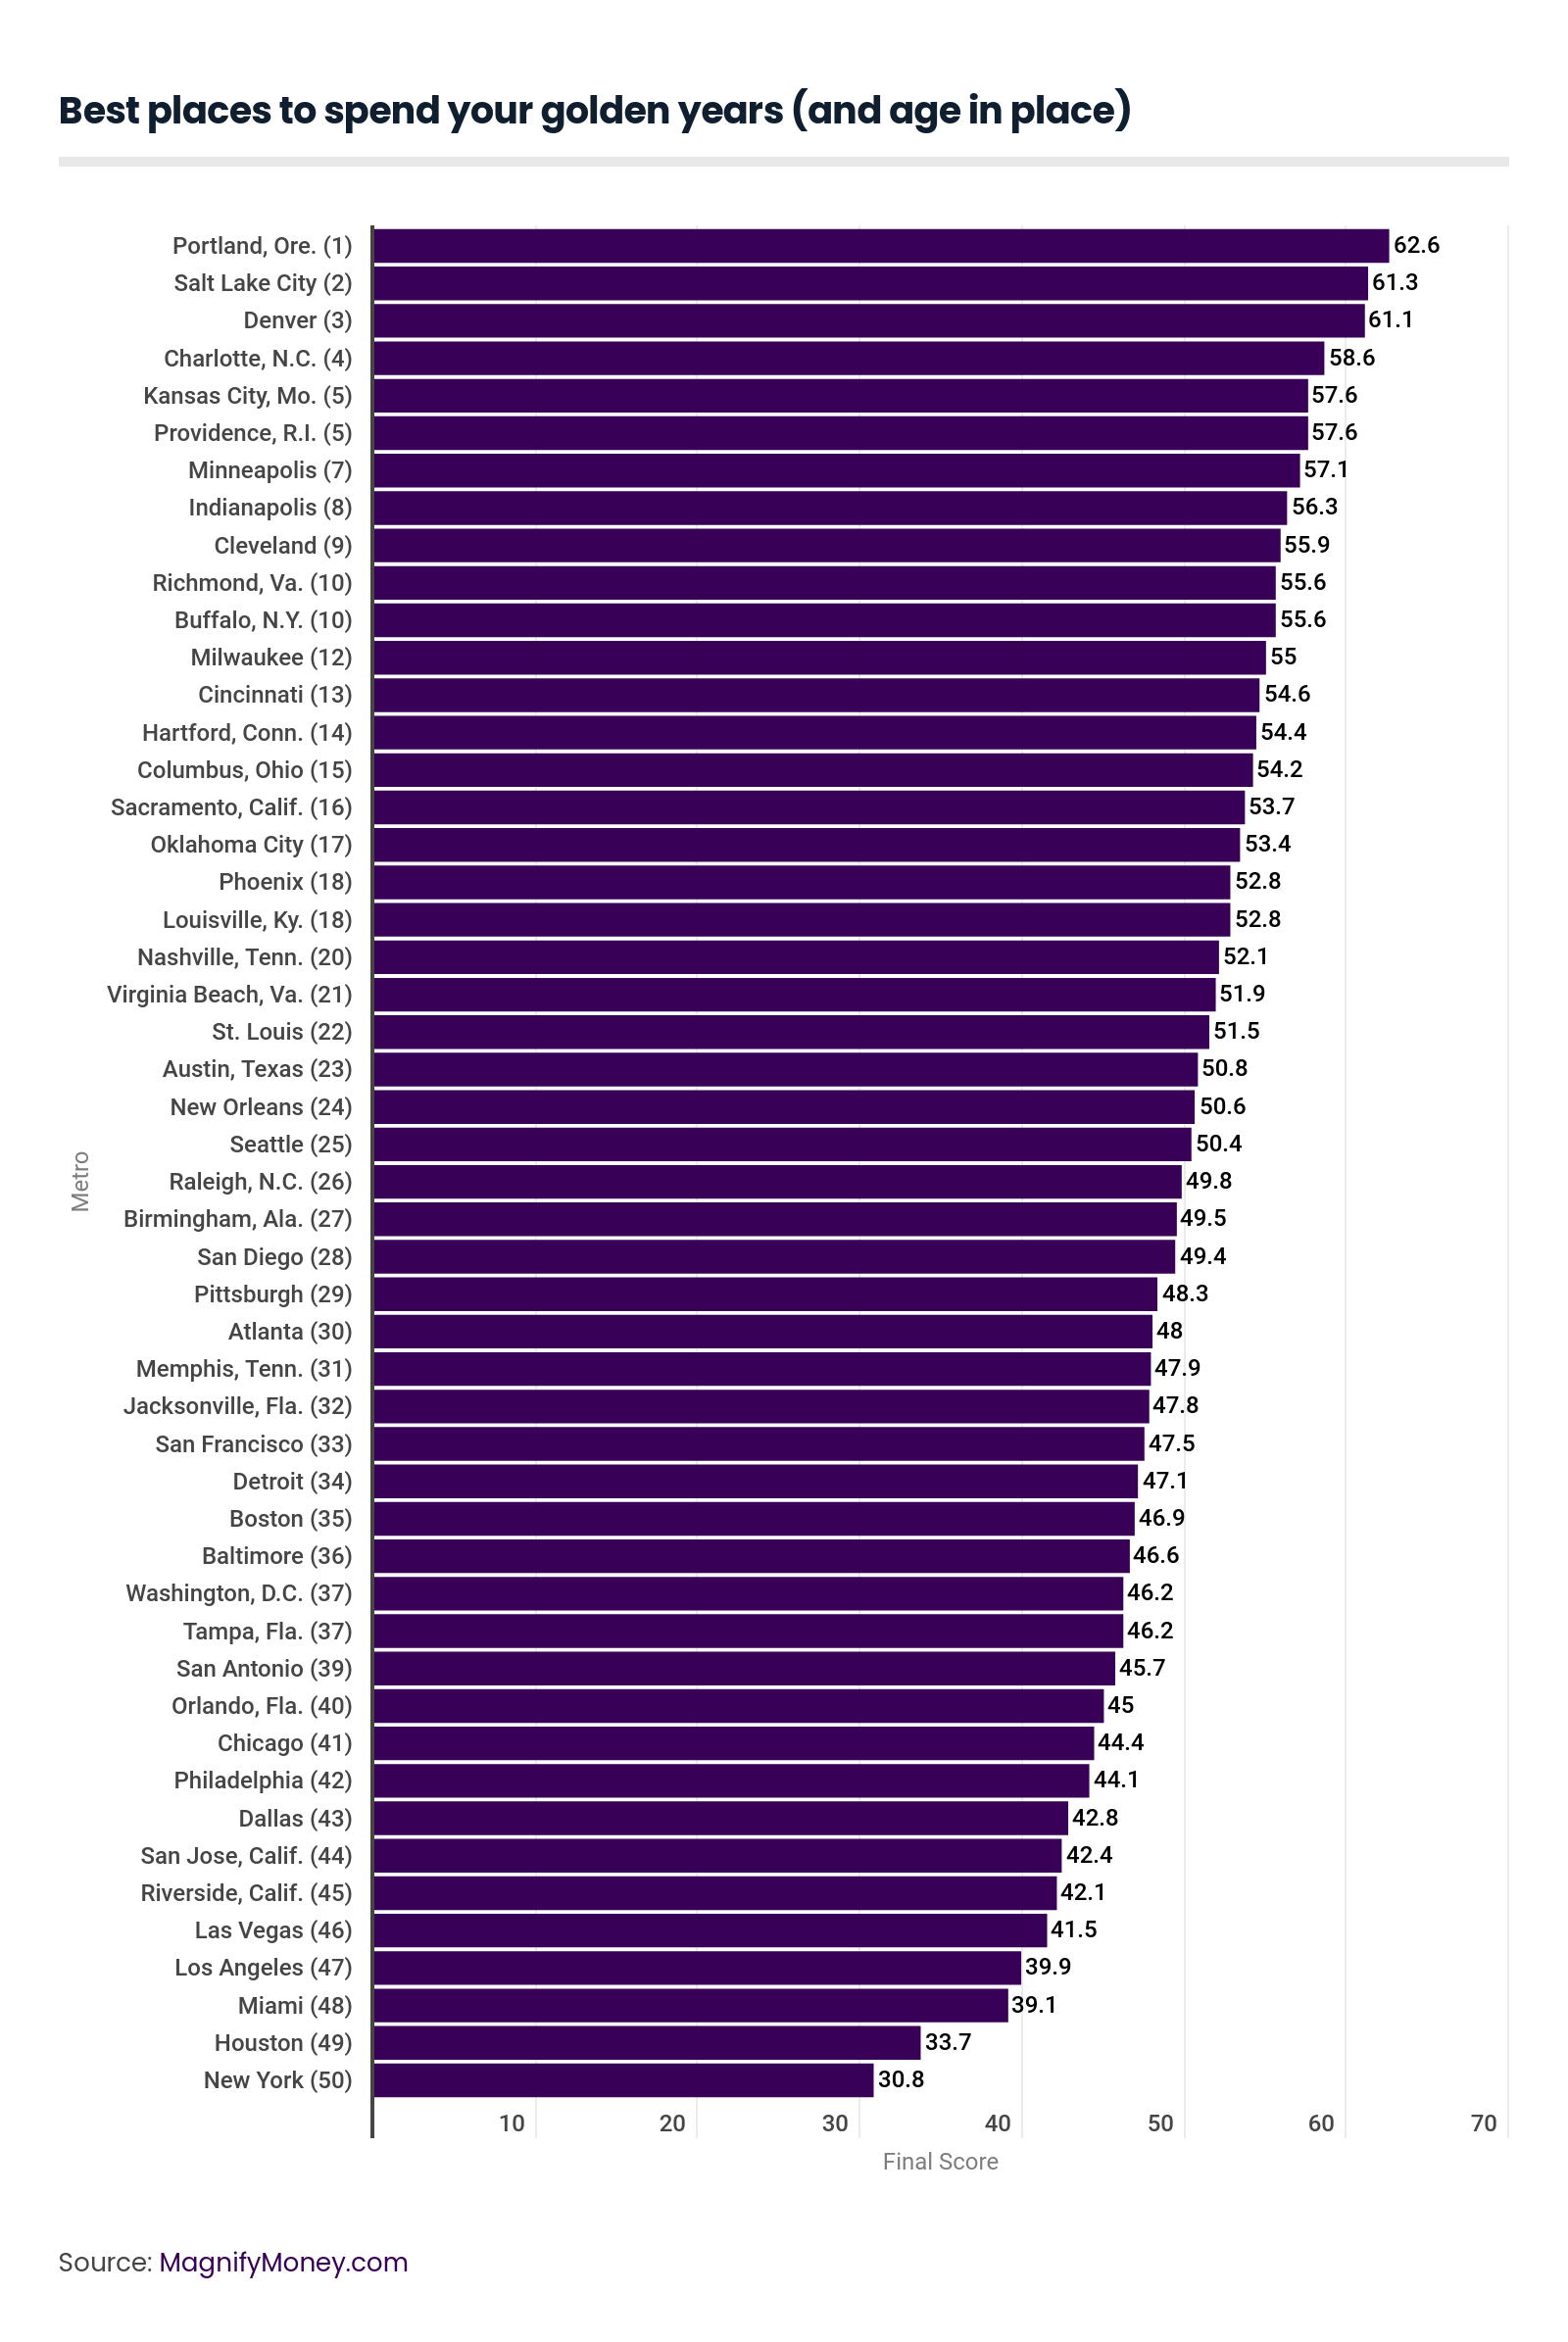
Final score: 62.6
About 6% of Portland’s population ages 65 and older moved there from somewhere else in 2016, the highest rate of any metro on our list, which implies that retirees who have ability to move find Portland highly desirable. The metro boasts an 82.6% activity rate, and while housings costs are higher than average at $1,236 per month, costs for goods and services are a smidgen below the nation’s average. Seattle was the only metro on our list to get a medical quality and cost score higher than Portland’s score of 79.8. Portland falls short in the availability of assisted care services, however, with fewer than one home nursing provider per 100,000 residents, and they’re not rated particularly well by Medicare. A lack of nursing homes and continuing care retirement communities leaves Portland with an assisted care quality and availability score of 21.1; the average among metros we reviewed was 38.4.
Final score: 61.3
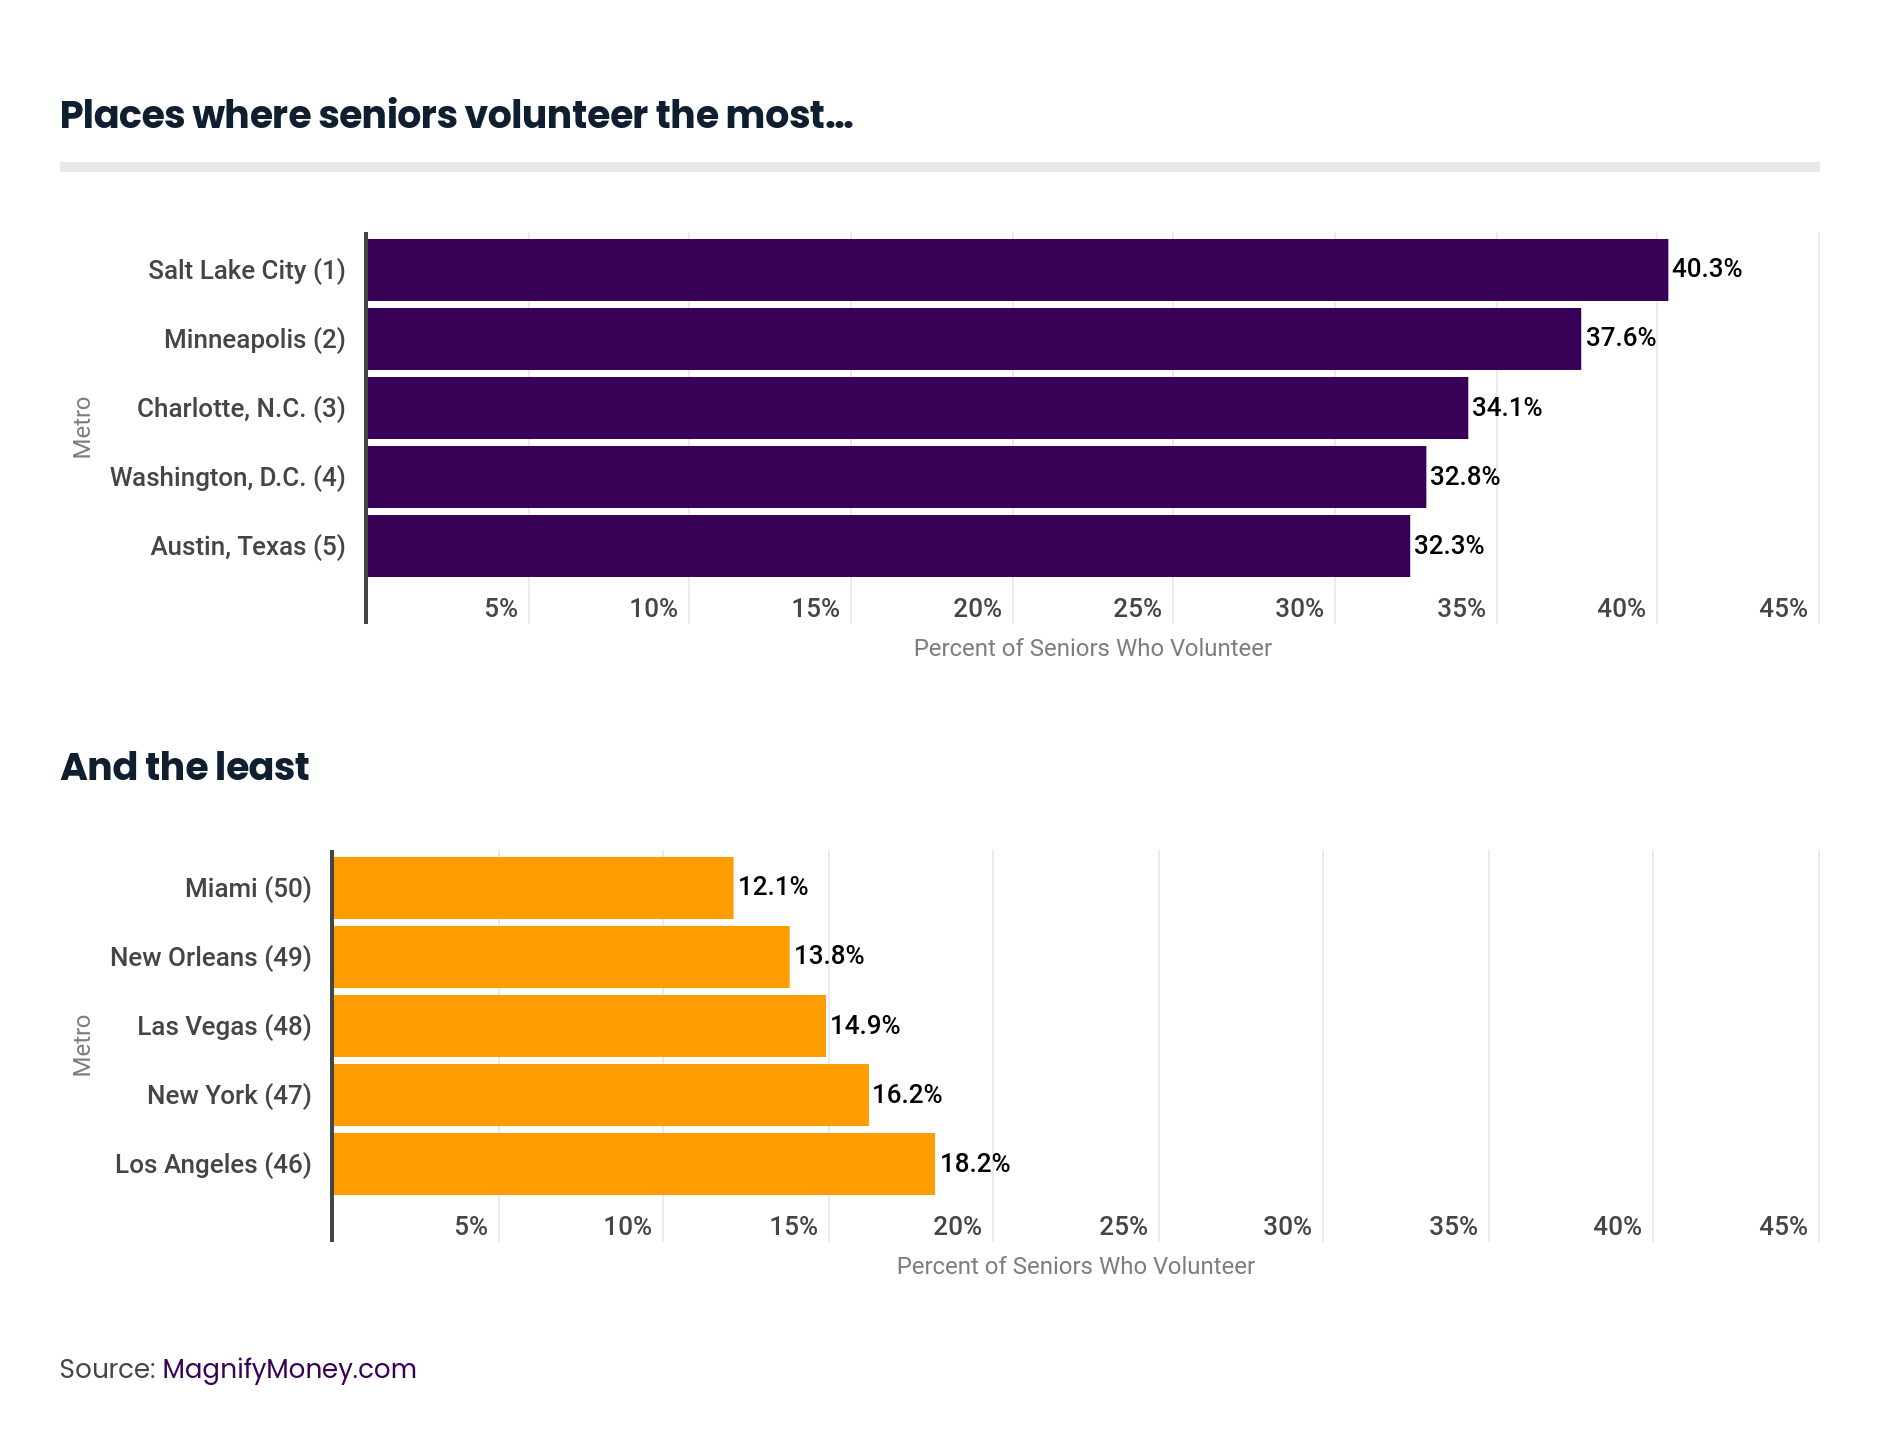
Salt Lake City seems to have the most engaged senior community, with 40.3% of people over the age of 55 volunteering, far in excess of the 24.7% average among the 50 metros we reviewed. Residents in the metro are also a bit more active than many other places, and at 27.6%, the metro has the lowest rate of preventable hospital stays. That may explain why, at $8,914, the average healthcare cost per Medicare patient is lower than the $9,627 average for the 50 metros. The metro could use a boost in their assisted care and quality availability, earning a score of 35.4, which is lower than the average of all metros we reviewed. Interestingly, Salt Lake City does not appear to be a draw for seniors, as only 1.5% of them moved there from elsewhere.
Final score: 61.1
Residents in only two other metros (San Francisco and San Diego) get more physical activity than in Denver, where 83.3% do, and that combined with the fourth highest percentage of seniors who moved into the metro from elsewhere brings Denver’s lifestyle score to 75.5 – drastically higher than 50 metro average of 43.8. At just 29%, the Mile High City has the third lowest rate of hospitalizations of Medicare recipients are for preventable causes, and the medical quality and cost score is 75.9, compared with the average of 48.3 across all 50 metros. On the downside, median housing is quite expensive at $1,285 per month, higher than the national average, and the metro could use some additional assisted care options.
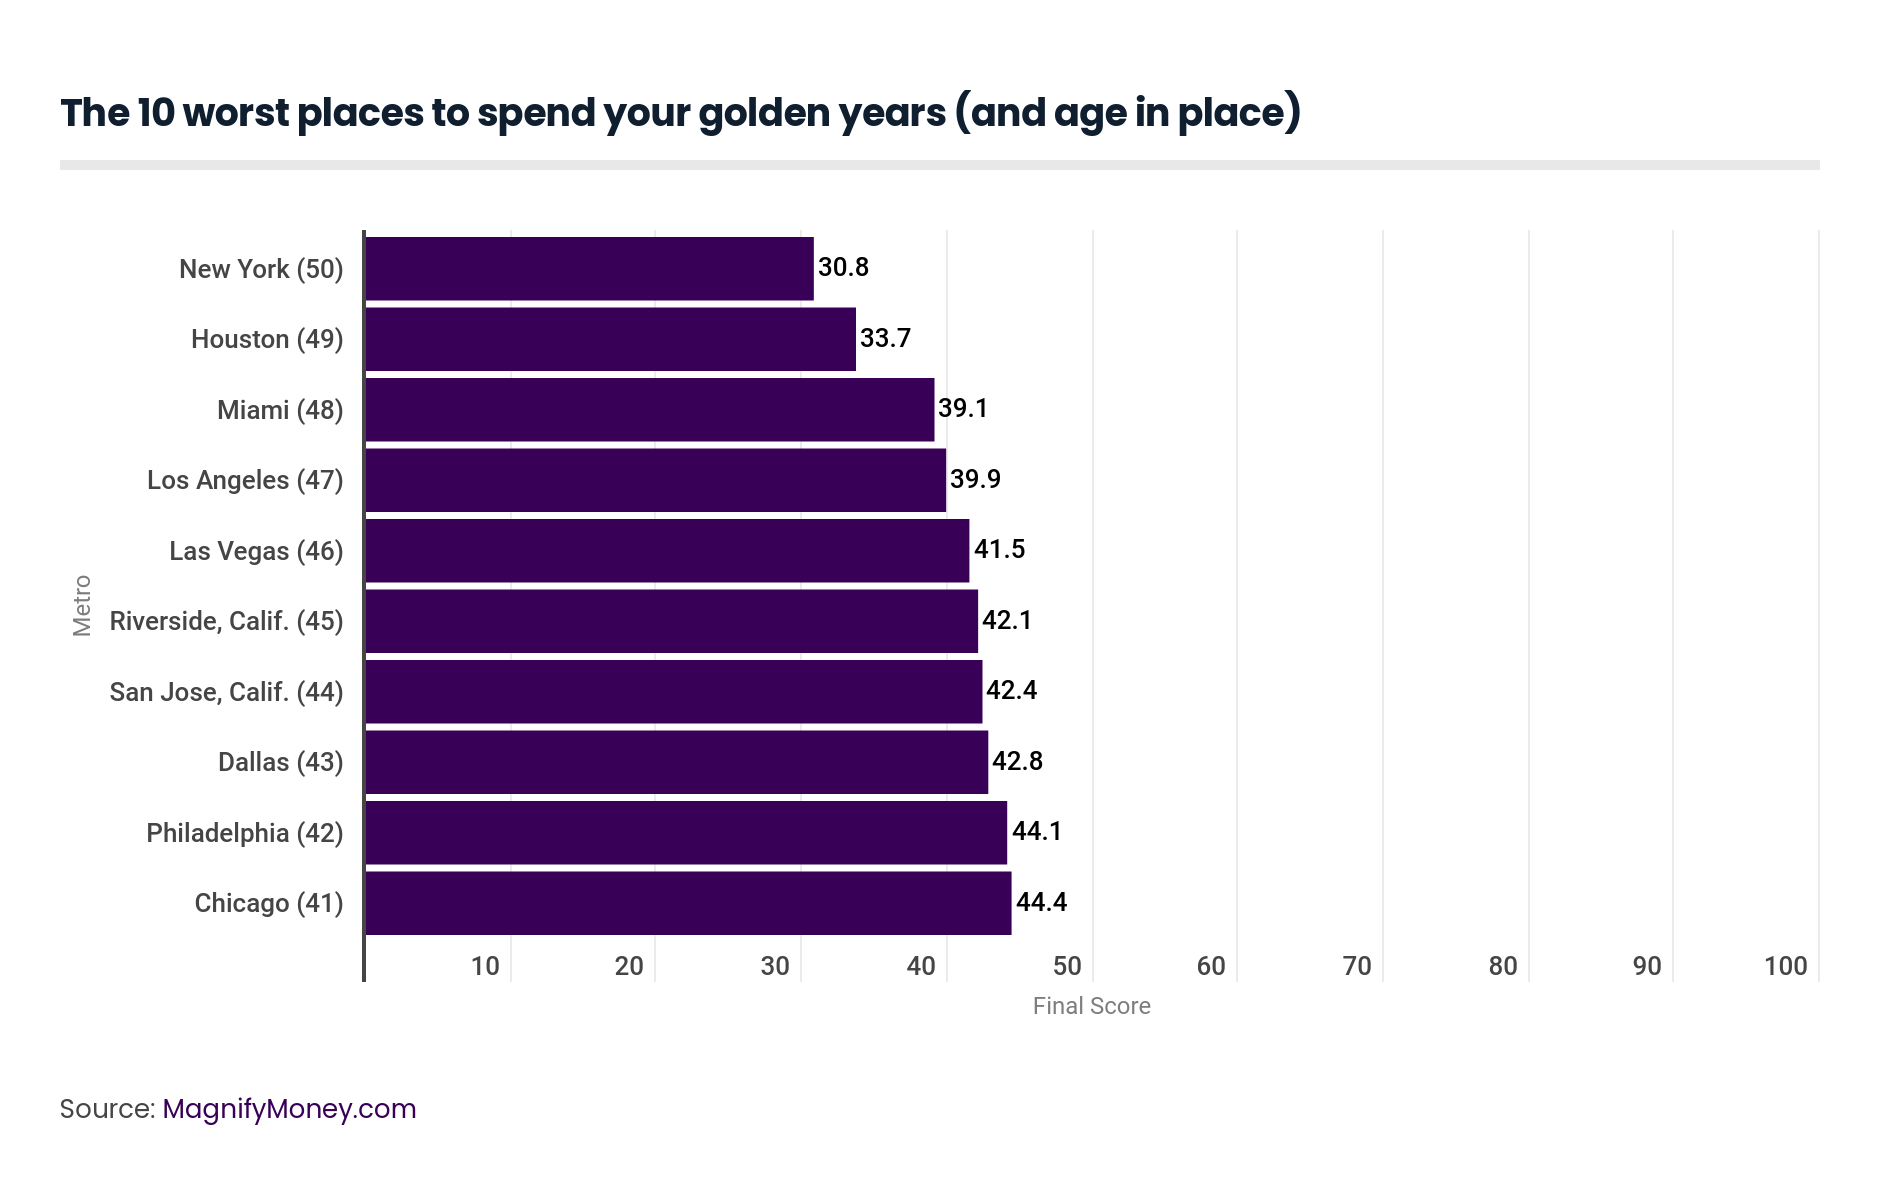
Final score: 30.8
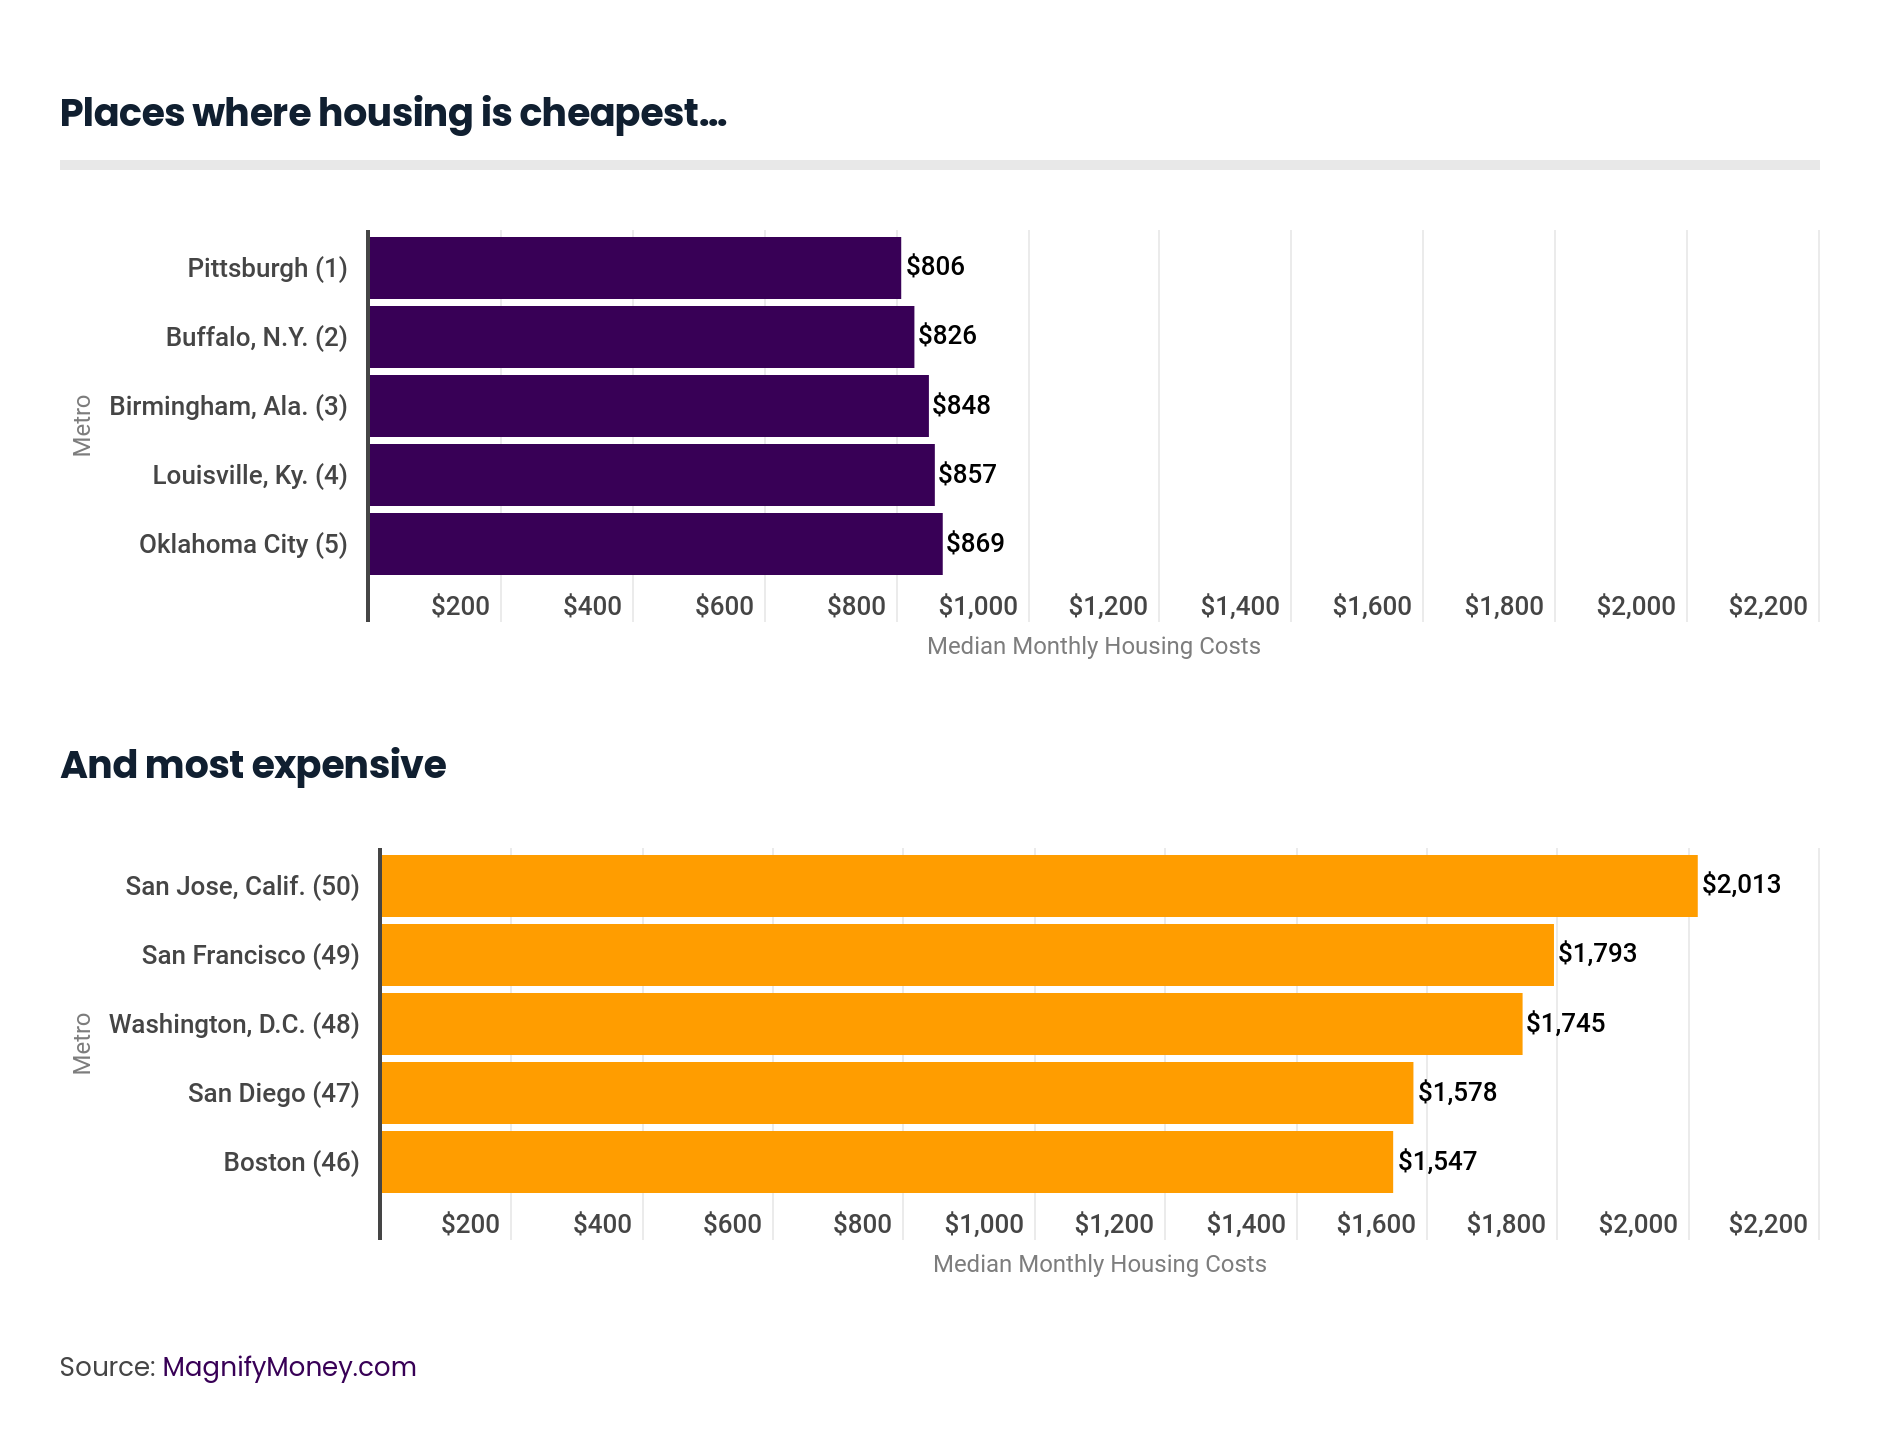
Those who always dreamed of moving to New York City sometime in the future may be disappointed to know that senior citizens don’t fare very well there. Community engagement is low, with only 16.2% of seniors volunteering, although locals do get a respectable amount of physical activity. The big issue for the Big Apple is the high cost of living: The metro has the highest costs for good and services, and median monthly housing costs for the metro are $1,528. Health care also isn’t as good as it could be, with the metro earning a score of 34.0, compared with the 50 metro average of 48.3. The upside is that assisted care availability score just bumps over the metro average at 39.0.
Final score: 33.7
Houston needs to improve in several areas, but where it does worst is in the availability of assisted care. The metro has fewer than one home nursing service provider for every 100,000 residents, and fewer than 295 beds per 100,000 residents (compared with the 50 metro average of 463.3). What’s more, the average Medicare ratings for nursing homes is the lowest of any metro we reviewed, at 2.3. All of these things combined to give the metro the lowest assisted care availability and quality score by a considerable margin (19.3). The metro also performed very poorly for medical care quality and cost, earning a score of 24.5, compared with the 50 metro average of 48.3.
Final score 39.1
Surprisingly for a place we often think of as a mecca for retirees, Miami isn’t the ideal destination we saw in “The Golden Girls” TV series. Senior volunteer rates of just 12.1% are the lowest of any metro we reviewed, the average cost per Medicare enrollee is the highest ($11,582) and it has the fourth lowest rate of seniors being up-to-date on preventative care (26.3%). Miami runs on the low end of the middle of the pack for cost of living, but it does much better in assisted care availability and quality, earning a score of 46.9, compared with the 50 metro average of 38.4.
It stands to reason that with so many elements to consider, no metro can beat the others in every single area, and some metros that rise to the top in one area we measured sink to the bottom in others.
It’s important for individuals and couples to decide which elements are most important for their later years and make their choices accordingly.
It’s also essential for communities to make improvements in their weakest areas as the number of retirees continues to skyrocket.
Data was grouped into four categories:
Lifestyle
Cost of living
Medical quality and cost
Assisted care availability and quality
The data was aggregated to the metropolitan statistical area level (“MSA”) and limited to the 50 largest MSAs by population. Where necessary, statistics were derived using the 2016 population data from the “Comparative Demographic Estimates” table for 2016 from the US Census Bureau’s American Community Survey 5-year estimates (available here.)
Each category was scored individually by created a relative value for each component, summing them together, and then dividing by the number of components, for a highest possible score of 100 and a lowest possible score of zero. The sum of these four categorical scores were then divided by four to create the final score, with a highest possible score of 100 and a lowest of zero.
 Kali McFadden
Kali McFadden is a senior research analyst at LendingTree and MagnifyMoney based in Charlotte, N.C., where she conducts data-driven studies of issues related to personal finance and economics.
Read More