MagnifyMoney 

Talk of universal basic income (UBI) in the U.S. remains in the news nearly a year after a presidential election and amid a global pandemic. Though measures like economic impact payments (stimulus checks) and advance child tax credits have been compared to UBI, a federally guaranteed income program in the U.S. seems far off.
Americans widely support the idea, though. MagnifyMoney researchers surveyed 2,050 U.S. consumers, finding that 72% support some form of UBI, with most hoping the payments would go to certain groups of people rather than all adults.
Politicians looking for a popular initiative could be advised to explore legislative options for universal basic income. UBI in some form garners approval from 72% of consumers. While 38% might change their mind under certain circumstances, a strong 35% of folks support UBI in any form.

Each demographic breakdown of UBI support tracked by the MagnifyMoney survey bolsters the finding that higher earners are less likely to back the idea. A 2018 Grinnell College poll found Republicans on average have higher incomes than Democrats, with 26% of Republicans earning more than $100,000, compared with 20% of Democrats.
While the policy idea wins a majority approval on both sides of the political aisle, Democratic voters are more likely to support UBI than Republicans:
Democrats (28%) are more likely than Republicans (18%) to contact their elected officials about UBI, but those calling aren’t necessarily in favor. In fact, 7% of both Democrats and Republicans report calling their representatives to oppose UBI. Additionally, 11% of independent voters have made calls to oppose the idea.
Those earning $100,000 annually or more are significantly less likely to support UBI than any other income group, with 64% saying they would endorse some form. Folks earning less than $35,000 support UBI the most, with 76% in favor. Support for UBI drops slightly among the middle income brackets, but hovers within a few percentage points among each group earning less than $100,000:
Men — who notoriously make more money on average than women — are less likely to support UBI than women:
And when it comes to age, baby boomers — the wealthiest generation — are the least likely to support UBI, deviating from their younger counterparts by 13 to 25 percentage points:
According to MagnifyMoney senior economic analyst Jacob Channel, younger folks tend to make less money, so they logically would be interested in this form of government aid. For baby boomers, Channel says the culture in which they came of age plays a role.
“On top of that, because they’re wealthier than younger generations, baby boomers tend to be a little bit more conservative with money,” Channel says. “They’re more concerned about things like inflation and higher taxes than younger generations are, largely because those issues would be more likely to negatively impact them.”
The coronavirus pandemic and the resulting economic fallout inspired many to rethink how people have their needs met — and whether it’s the government’s responsibility to meet them. The stimulus payments offered a glimpse into possible UBI outcomes, as the checks allowed many families to pay off some debt or cover necessary expenses.
As a result, 45% of consumers say the pandemic made them more supportive of UBI, versus just 14% who say the crisis made them less supportive of the idea.
Supporters of UBI appear to believe in the positive outcomes that inspire the idea in the first place. It seems supporters have faith in the policy’s ability to lift people out of poverty, provide economic stability and give people financial security. Here’s a full breakdown:
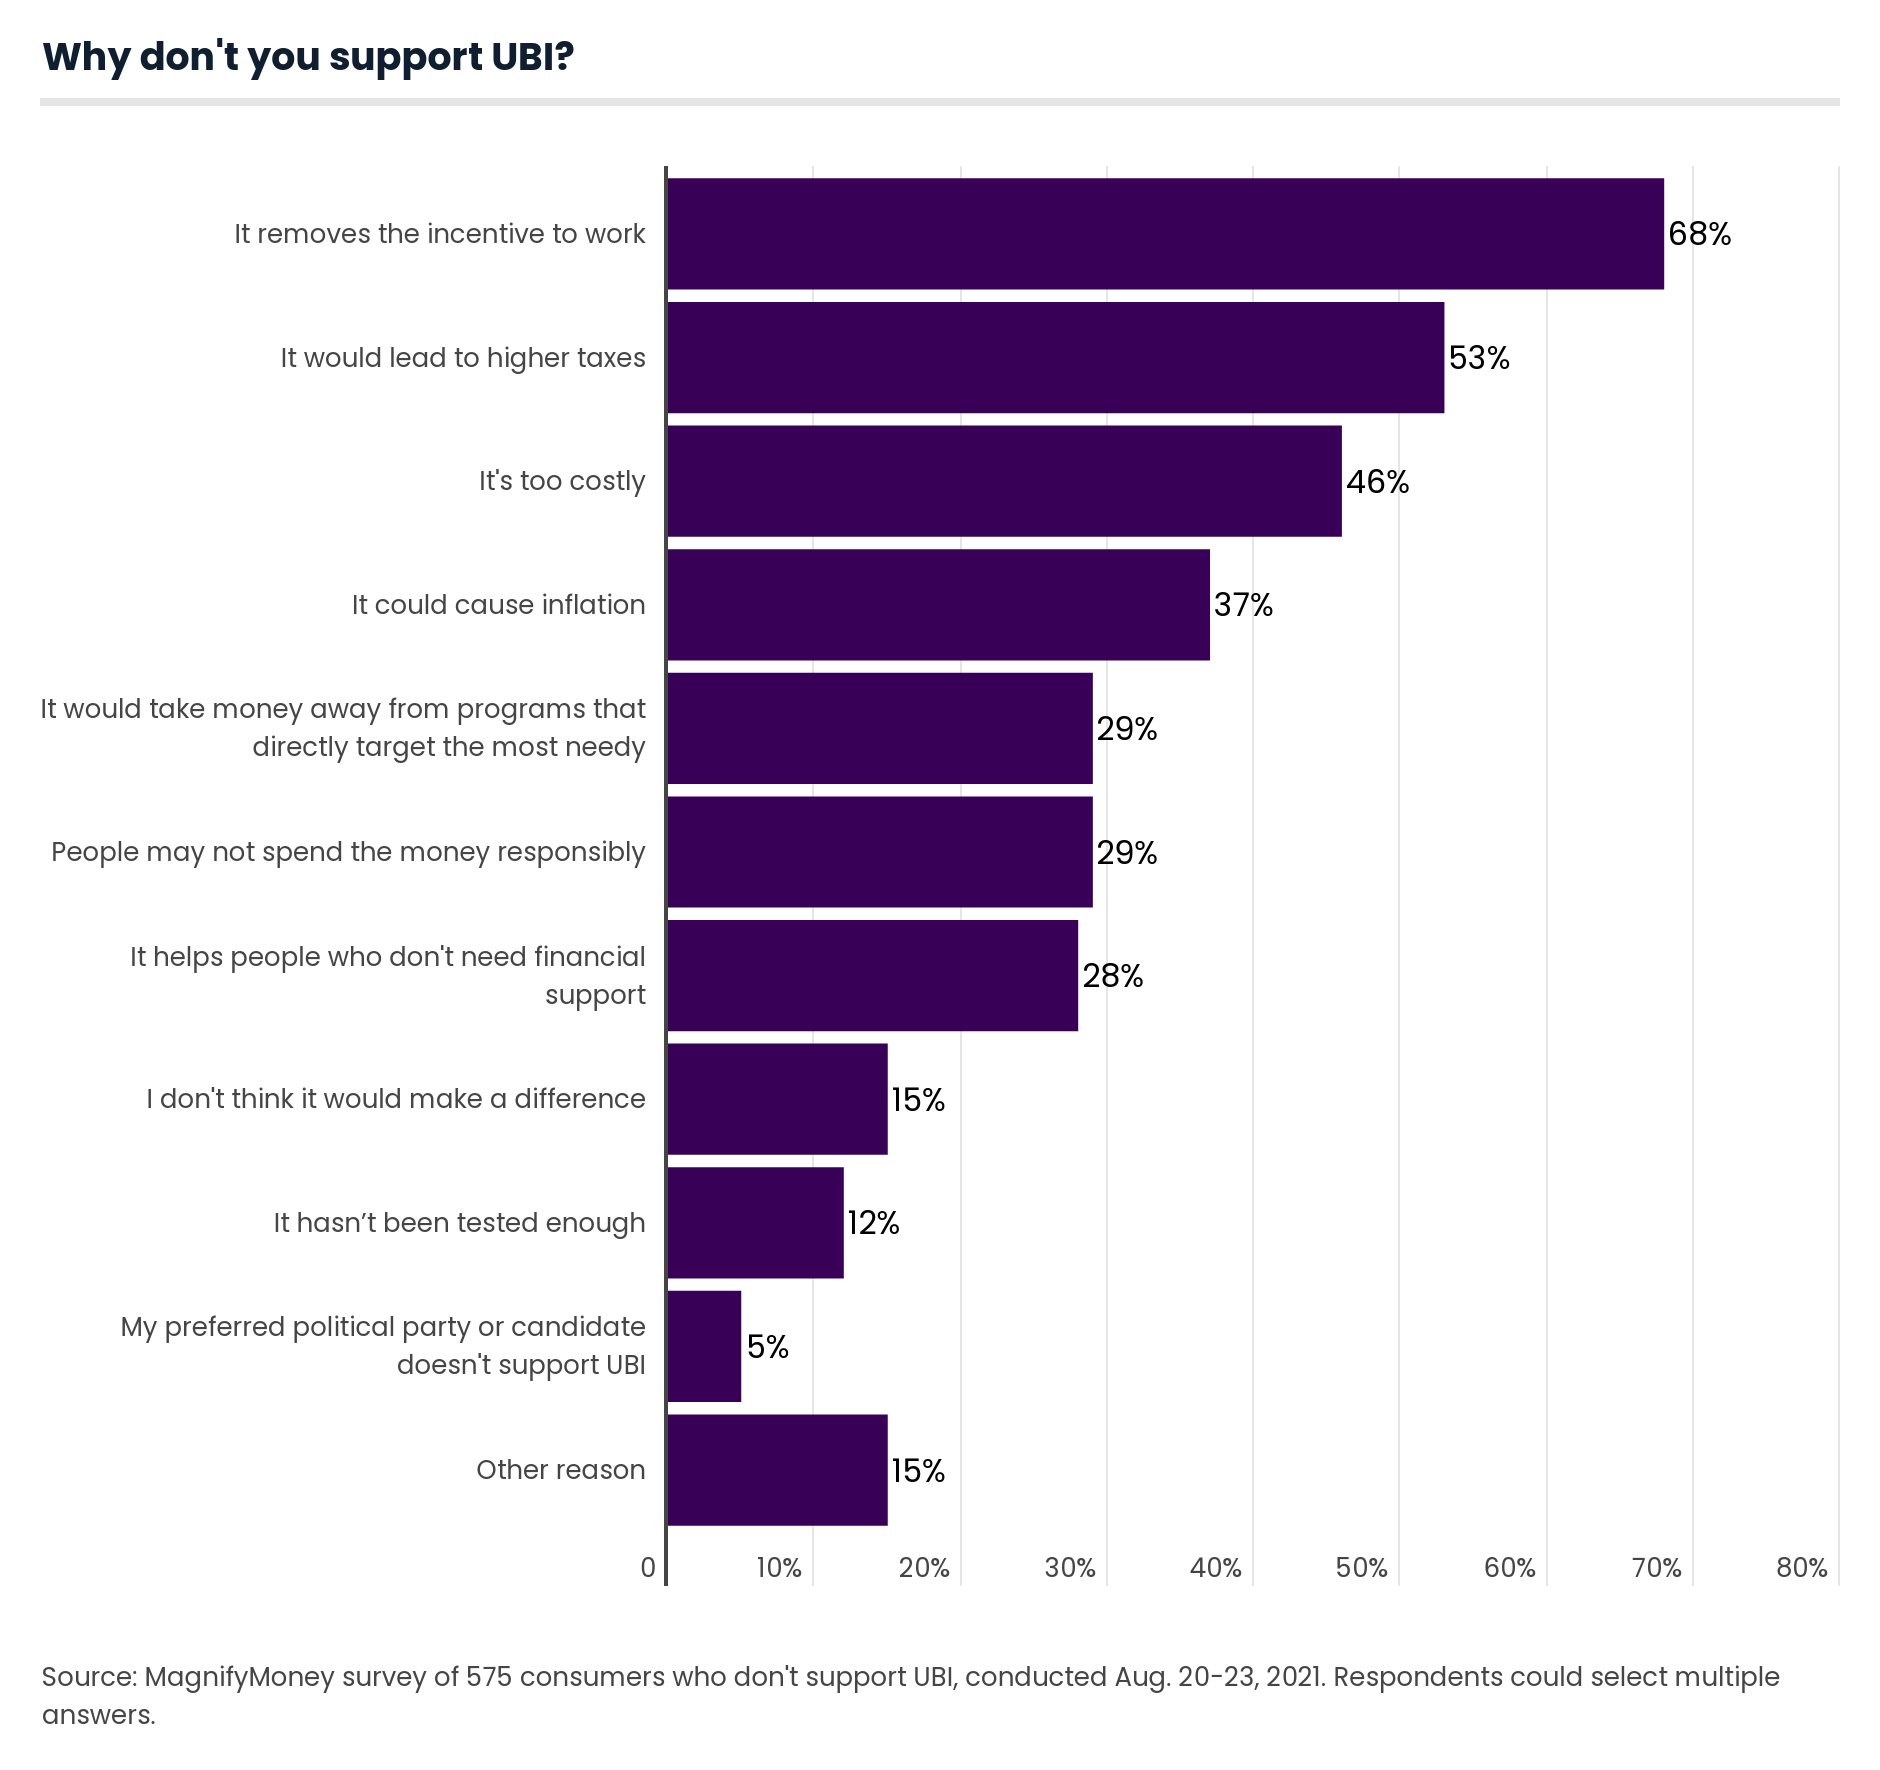
Those who oppose UBI in any form feel strongly about people working for a living, with 68% of nonsupporters saying that UBI removes the incentive to work. Additionally, a large share of respondents assumes UBI will be too costly and lead to higher taxes.
Many of the outcomes of a large-scale UBI program would depend on the implementation and how the details pan out. However, it’s difficult to predict whether a national UBI program would follow the patterns of smaller UBI experiments. States like Alaska and municipalities like Stockton, Calif., that have piloted UBI programs have mostly dispelled the hypothesis that UBI leads to a reduction in employment.
Considering the expanded unemployment benefits due to the pandemic as a form of UBI, Channel suggests the government aid could have at least slowed down employment, but the broader circumstances of the pandemic likely contribute.
“There were a lot of other factors at play that could have kept people from working, like fear of catching COVID-19,” Channel says.
The same percentage of consumers who support UBI — 72% — believe all Americans should be guaranteed enough money to afford basic needs like food and shelter. However, it appears the majority of consumers would prefer targeted payments to help those most in need.
Just 14% of all consumers think the payments should go to every adult living in the U.S. if the government implemented UBI. As for who should receive a guaranteed income, consumers mostly think recipients must have U.S. citizenship and/or earn below a certain income level, with both conditions garnering 43% of respondents’ endorsement. Another 34% of folks think recipients of the hypothetical UBI must be working or actively seeking employment.
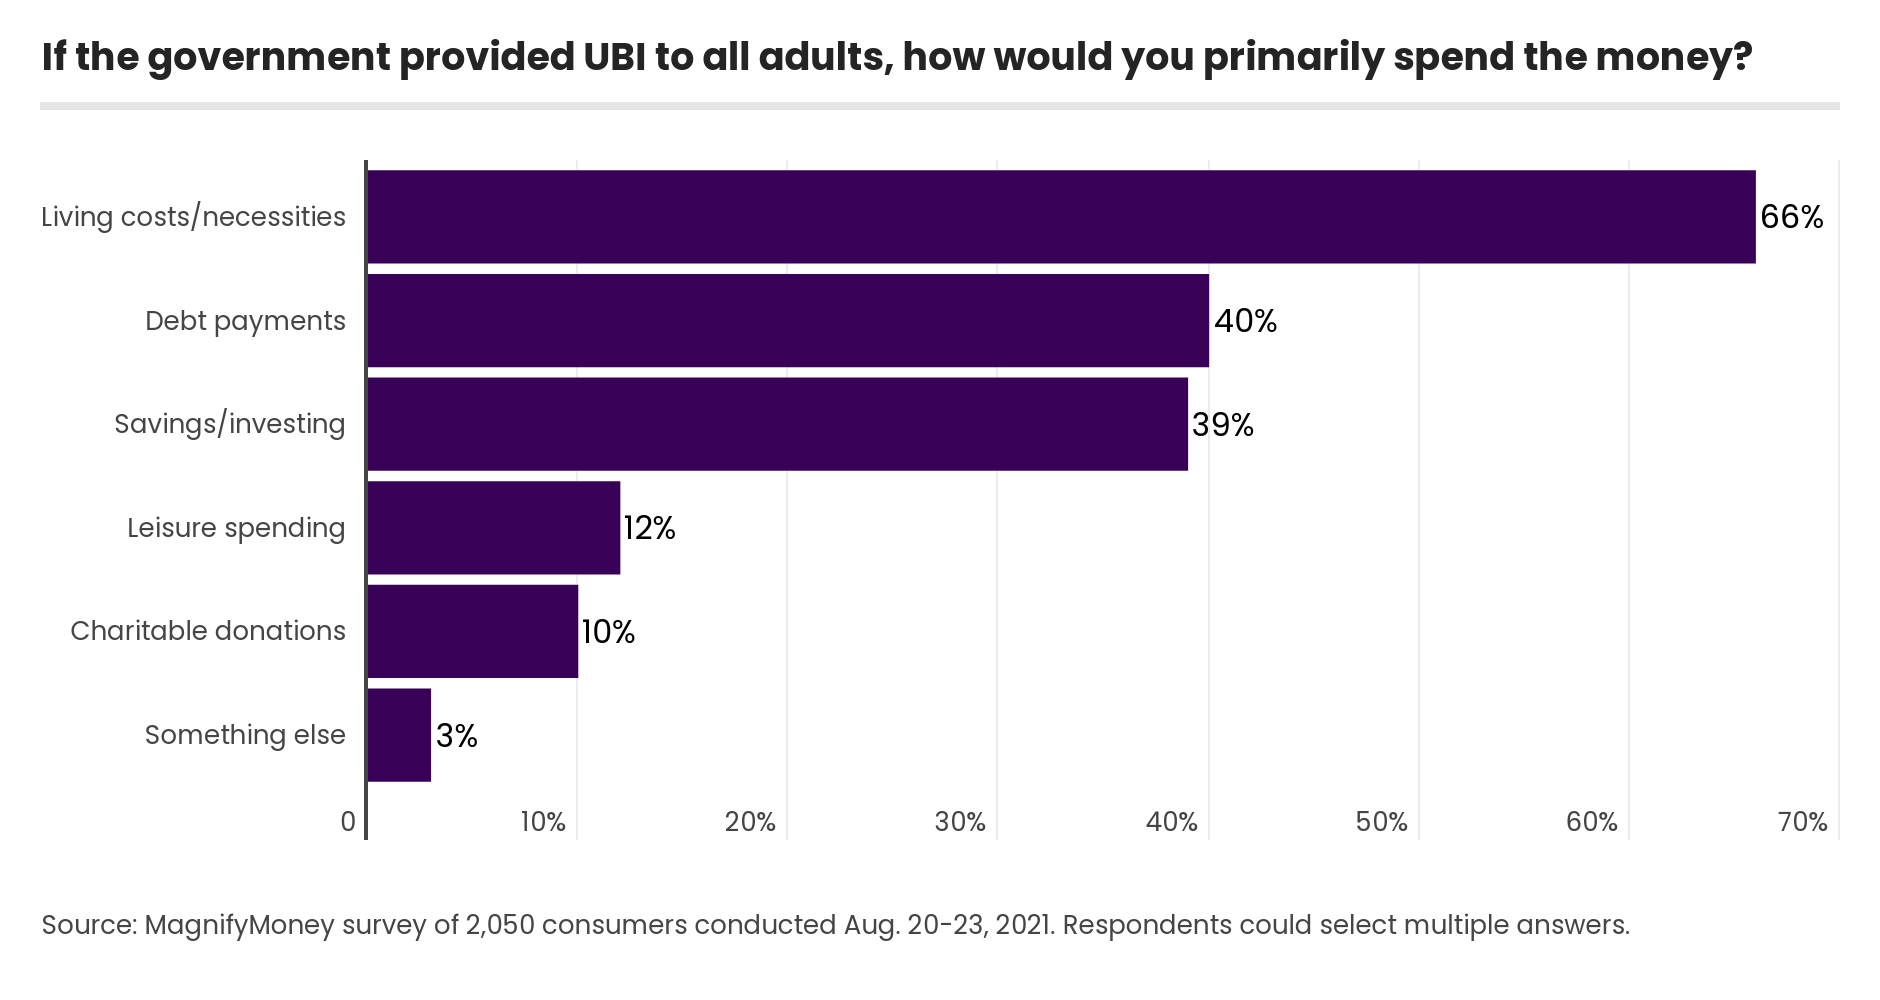
Overall, respondents aren’t looking for extra spending money or cash to feed their vices. Just 12% of consumers say they’d spend a hypothetical government UBI payment on leisure spending, versus 66% who say they’d spend it on necessities and living costs.
Additionally, a majority of consumers — 69% — say a $1,000-a-month UBI would help them save more for retirement.
A significant share of consumers says UBI could make a real difference, with 22% of respondents saying they need UBI to make ends meet. In particular, women and parents of children younger than 18 report needing this aid, with 25% and 28%, respectively, in agreement.
Of the 42% of respondents who say they don’t need UBI, the majority aren’t looking to give it away either. Thirty percent of consumers say they don’t need the payments but would find a way to use it, while 12% who say they don’t need it would donate their payment.

One of the best ways to grow wealth is to create passive income streams by putting your extra cash in places where it’ll grow.
Should the government send out another round of stimulus checks as the pandemic goes on, or if you receive a tax refund or even win the lottery, take the spare cash and turn it into a basic income stream with an interest-earning savings vehicle:
MagnifyMoney commissioned Qualtrics to conduct an online survey of 2,050 U.S. consumers from Aug. 20 to 23, 2021. The survey was administered using a nonprobability-based sample, and quotas were used to ensure the sample base represented the overall population. All responses were reviewed by researchers for quality control.
We defined generations as the following ages in 2021:
While the survey also included consumers from the silent generation (those 76 and older), the sample size was too small to include findings related to that group in the generational breakdowns.
 Kamaron McNair
Kamaron McNair is a former editorial assistant for LendingTree, where she wrote content, provided administrative support and ran the social media for MagnifyMoney and other LendingTree properties.
Read More